
Figures & data
Figure 1. (A) Map of southern west Greenland with the field site marked with a black square. (B) Aerial photograph of the field site with three persons plus rucksacks for scale. (C) Example aerial image from our UAV footage with orange scale markers (90 mm diameter) visible
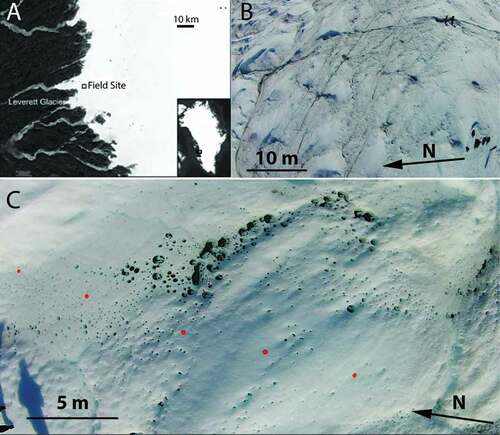
Table 1. One-way ANOVA to test for significant differences among any of north-sloping, south-sloping, or flat ice for each shape descriptor. The significant pairs were identified using a post-hoc Tukey test
Figure 2. Mean sediment thickness for all holes (A) and after removal of hydrologically connected holes (B). Mean slope of linear trend fit to sediment thickness data for all holes (C) and after removal of hydrologically connected holes (D). In all four panels error bars are 1 sigma
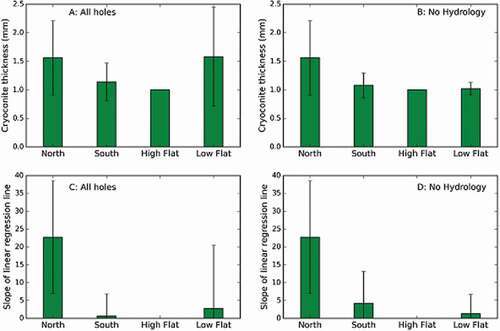
Figure 3. Sequential snapshots of the hole sediment thickness on the hole floor in four holes. The three columns are three time points after initial overload (on Day 2, Day 5 and Day 7). The rows are different holes. North = hole on north slope; Flat = hole on flat ice; South = hole on south-sloping ice; Hydro = hole on flat ice that was invaded by hydrological flow. The color bar refers to the thickness of cryoconite. Measurements were made every 10 mm along each axis and joined with straight lines. These are examples selected from the full dataset
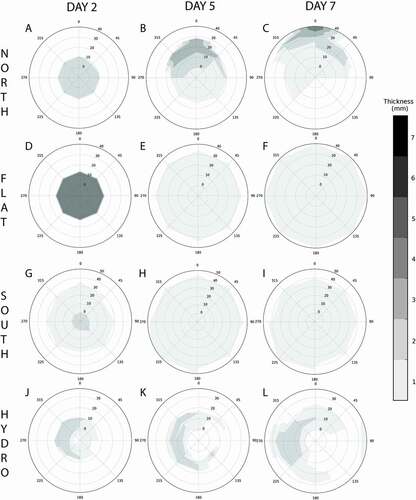
Figure 4. (A) Plot of NEP values for holes in each of the four topographic settings. (B) Plot of NEP values at the downslope (blue) and upslope edges of cryopools
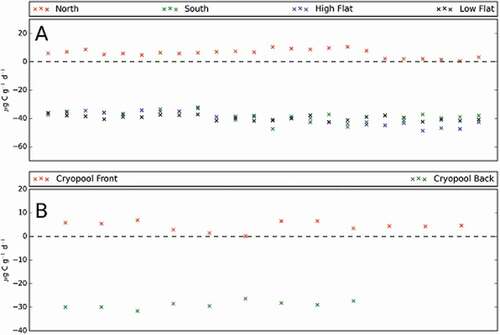
Figure 5. Sequential snapshots of the simulated ice surface at timesteps 1, 5, 10, 50, 100, and 200. Each grid consists of 100 columns and 150 rows. The upper 125 rows are sloping from the top to bottom of the frame and the lower 25 rows are flat. The initial conditions were: 2 percent surface coverage, sediment delivery to one row every five timesteps, single layer speed = 0.25, multilayer speed = 0.6, flat speed = 0.05. The color bar refers to the thickness of cryoconite in each cell
Figure 6. Change in cryoconite hole frequency (A), area (B), circularity (C), and roundness (D) over time as predicted by our cellular automaton
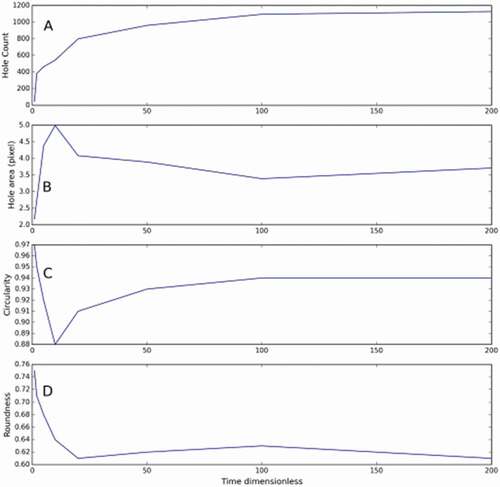
Figure 7. Schematic showing the proposed mechanism of cryoconite hole migration driven by topographic shading. In (A) the hole is shaded by the topographic rise, leading to heterogeneous hole-floor irradiance. This enhances melting in the illuminated areas, causing the hole floor to slope. The result of this is that cryoconite slumps downslope because of gravity, banking up against the downslope wall. Because of thermal fluxes through the dark sediment layer, this downslope wall melts more rapidly, ceating space for the cryoconite granules to slump into, advancing the hole wall further. In (B) the mechanism of cryopool formation is illustrated, whereby holes that migrate downslope eventually coalesce at the break of the slope, where the driving force of topographic shading is diminished. In (C) a south-facing slope is shown for contrast. The more prolonged illumination at more vertical solar angles prevents uneven melting of the hole floor and promotes a deep, flat-floored, cylindrical hole morphology rather than complex shapes and hole migration. The North arrow applies to all subfigures
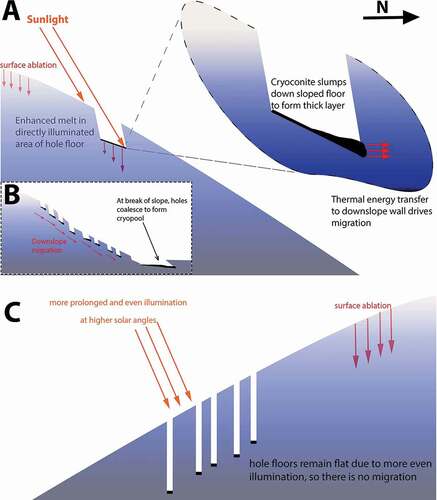
Figure 8. (A) A naturally occurring pinnacle formed by exposure of bare ice during sediment migration (scale bar = 30 cm). (B) A sequence of cryoconite holes becoming more irregularly shaped with distance down a short north slope, and a cryopool at the slope base (scale bar = 50 cm). (C) Mass-movement morphology in the upslope area of a cryopool, immediately downslope of a relict cryoconite hole (scale bar = 10 cm). (D) An example image from a UAV flyover showing cryoconite holes on a north slope with a series of cryopools at the slope base (scale bar = 5 m). (E) A quadrat over a “track” running top left to bottom right (quadrat = 50 cm). (F) Two cryoconite holes merging because of hole migration (scale bar = 30 cm)
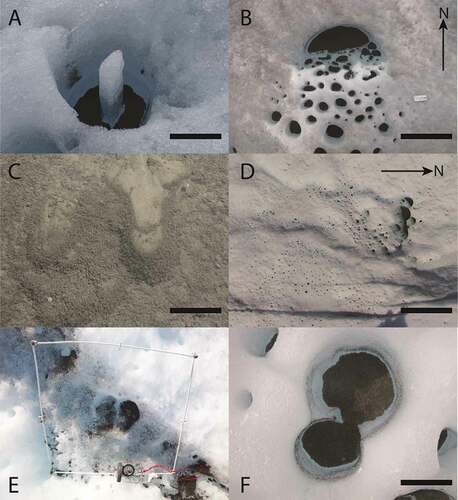
Table 2. Results of post-hoc Tukey HSD test between NEP data in each topographic setting (significant differences marked with asterisk)
Table 3. Mean, standard deviation, maximum, and minimum values for shape descriptors for modeled and real cryoconite holes in flat and north-sloping ice