Figures & data
Figure 1. MODIS images of the study area in August 2007 and March 2008. The red triangle shows the ice station in March 2011, and summer ice-free stations are shown in yellow (station 1), green (station 2), and blue (station 3)
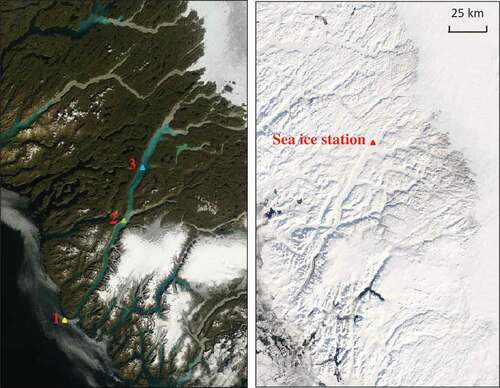
Figure 2. (A) Suspended particulate matter (SPM; g m−3); (B) salinity; and (C) temperature (°C) versus depth at the ice station (blue line) and at summer stations 1 (black), 2 (red), and 3 (orange)
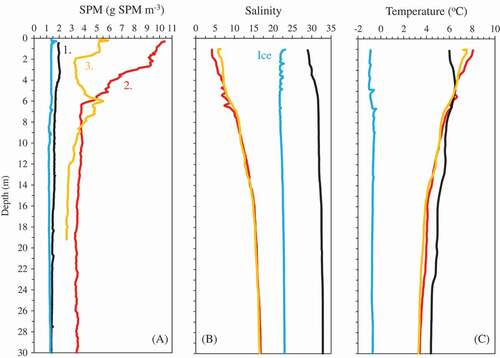
Figure 3. Spring albedo (snow and ice), summer reflectance (meltwater), net transmittance (%, in bold), and photic depths Z0 (m) for (A) snow-covered ice, (B) bare ice, (C) meltwater with medium (station 3) and high SPM (station 2), and (D) station 1
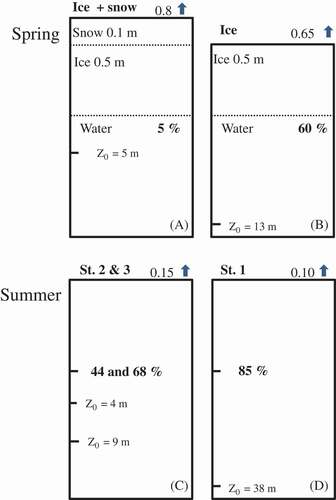
Figure 4. Spectral attenuation coefficient Kd(λ) in water below at ice station (blue line) and at summer stations 1 (black), 2 (red), and 3 (orange) between 400 and 700 nm
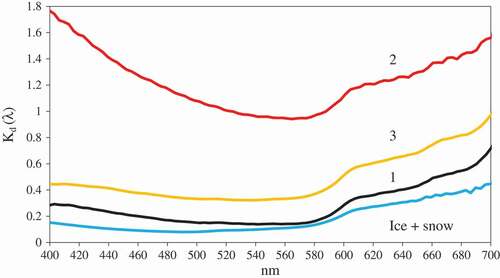
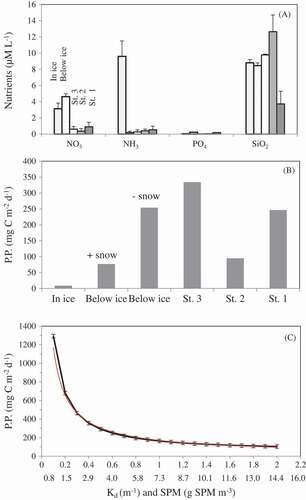
Figure 5. (A) Nutrient (NO3, NH3, PO4, and SiO2) concentrations (µmol L−1) in the ice, in the water below the ice, and at stations 1, 2, and 3; (B) primary production (mg C m−2 d−1) in the ice, in water below the ice with and without snow, and at stations 1, 2, and 3; (C) modeled primary production (mg C m−2 d−1) in the meltwater as a function of both light attenuation coefficient (Kd(PAR)) – upper x-axis and SPM (mg SPM m−3) – lower x-axis