Figures & data
Table 1. Summary of the range of phytoplankton end member data and its determination in previously published stable isotope mixing models
Table 2. Location, physicochemical properties, productivity, and vegetation cover of the study sites. The ponds are sorted by increasing DOC content. Bold values are mean ± standard deviation (SD) of the ponds in each category
Table 3. Summary of the averaged δ13C, δ15N, and δ2H values and standard deviation from the sources and aquatic consumers used for the mixing models. The δ2H values of consumers are adjusted accounting for dietary water in their body tissue
Figure 1. Primary production rates in water column (PP pelagic) and in benthos (PP benthic), as well as pelagic bacterial production rates (BP pelagic) along a DOC gradient. The dashed line discriminates between low-DOC (clear-water) ponds and high-DOC (brown-water) ponds
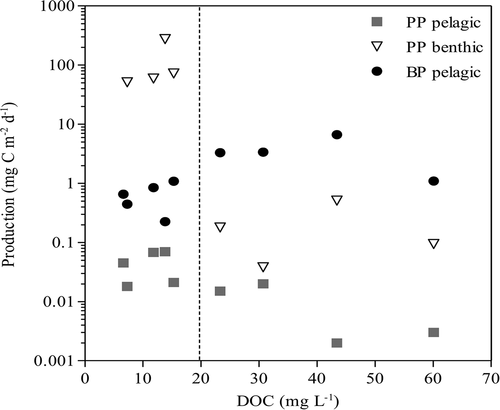
Figure 2. The distribution of δ2H and δ13C (‰) values by (A) mean of end to better show the separation by DOC concentration and (B) full spread of data with consumers and potential food sources. High-DOC ponds are marked with a dot, and low-DOC ponds are marked with a triangle. Aqp = aquatic plants, ben = benthic algae, dom = dissolved organic matter, peri = periphyton, phyto = phytoplankton, pom = particulate organic matter, terr = terrestrial, zoop = all aquatic invertebrates collected
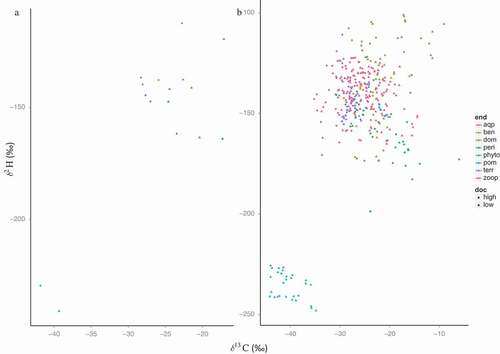
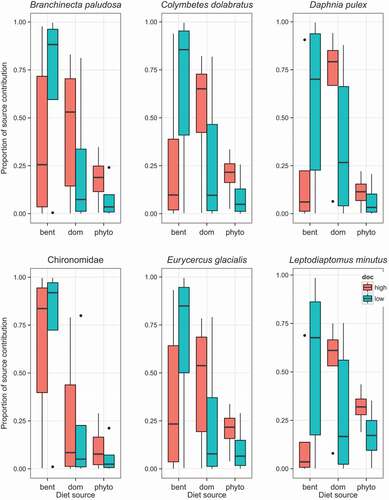
Figure 3. The contributions of benthic algae, dissolved organic matter (DOM), and phytoplankton-based carbon sources for the diets of the six most common aquatic invertebrates in high- and low-DOC ponds using a Bayesian mixing model, using δ13C, δ15N, and δ2H values. Whisker plots indicate the 95 percent Bayesian probability intervals