Figures & data
Figure 1. Location of the field area in southern west Greenland. (A) Map of Greenland showing the field area (red rectangle) and locations of the Dye-3 and GISP2 ice cores. (B) Map of southern west Greenland showing previously published ages of moraines (dashed lines), which delineate former extents of the GrIS margin (after Carlson et al. Citation2014; Levy et al. Citation2012; Ten Brink Citation1975; van Tatenhove, van der Meer, and Koster Citation1996; Weidick Citation1972, Citation1976; Winsor et al. Citation2015). Moraine ages are in cal kyr BP. Black dots represent 10Be deglaciation ages at the coast in ka (Roberts et al. Citation2009; Winsor et al. Citation2015). (C) WorldView-2 satellite imagery of the field area. We mapped moraines based on categorization by Ten Brink (Citation1975). The “undifferentiated” moraines refer to moraines that were not classified by Ten Brink (Citation1975), however, they may be coeval with the Keglen moraines. The orange star marks the location of Lake Lucy as referred to in the text (Young and Briner Citation2015)
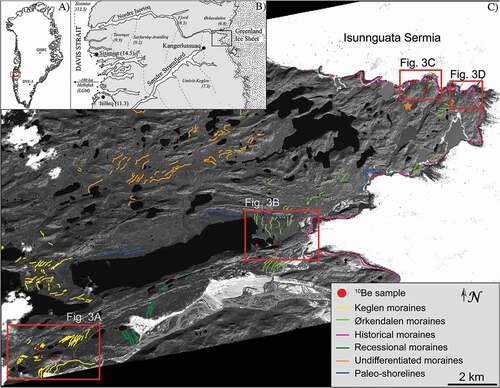
Figure 2. Photos of sampling locations. (A) Boulder (sample LL1109) on a right-lateral Keglen moraine. View to the southwest. The moraine continues in the background. (B) Boulder (sample LL1103) on a left-lateral Keglen moraine on Mount Keglen. View to the east. (C) Two distal-most historical moraines near sampling sites LL1137 and LL1139. The third, most proximal moraine is not pictured here, but it is just out of view to the right of photo. (D) Boulders distal to the historical trimline (marked by yellow dashed line). Note the vegetation growing on the boulders in the Ørkendalen drift in comparison to the trimline and the fresh, unweathered historical moraines in the background
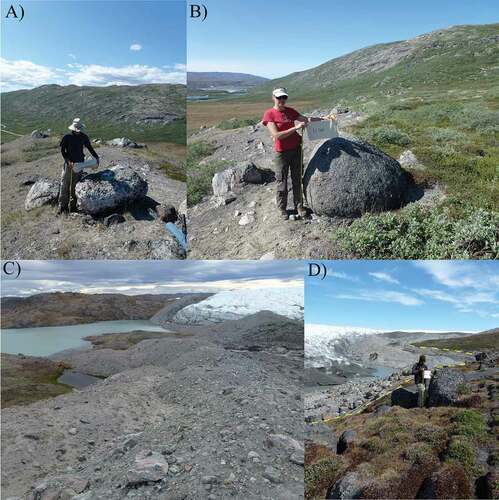
Figure 3. WorldView-2 satellite imagery showing the sample locations and ages (in ka). Sample name in parentheses with prefix “LL” removed. (A) Keglen moraines and boulder and bedrock samples atop Mount Keglen. 10Be samples from Winsor et al. (Citation2015) are outlined in blue. (B) Boulders on bedrock from the ridge on the south side of Moraine valley (JBC1006, JBC1007). Samples outlined in red are from Levy et al. (Citation2012). (C) Boulders on the historical moraine (LL1137, LL1139) as well as previously dated samples of Levy et al. (Citation2012) outlined in red. (D) Samples on the historical drift (LL1130, LL1131) and just distal to the historical trimline (LL1133)
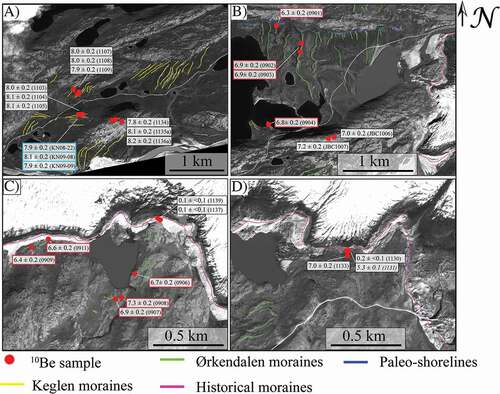
Table 1. 10Be ages and sample information of boulders on moraines, boulders perched on glacially polished bedrock, and bedrock. We calculated all 10Be ages using the Arctic production rate (Young et al. Citation2013b) and the time-invariant scaling scheme of Lal (Citation1991) and Stone (Citation2000). The 10Be/9Be ratio for the three processing blanks ranged from 1.42 to 5.62 × 10⁻¹⁶. The 10Be ages reported here are slightly older than those reported by Levy (Citation2014) and Winsor et al. (Citation2015). This difference is because of an updated concentration of the 4G Beryl carrier
Figure 4. Time-distance diagram showing 10Be deglaciation ages between the outer coast and the present-day ice margin, east of Kangerlussuaq. Retreat rates between the two coastal sites, Itilleq and Sisimiut, are shown. Note that the Sisimiut to Keglen transect is north of the Itilleq to Keglen transect. We use the retreat rate from Itilleq to the Keglen moraines (49 ± 13 m yr−1) because it follows the flow line of the GrIS along the fjord Kangerlussuaq. Note that the rate of less than 0.5 m yr−1 refers to a readvance of the ice margin during late Holocene time
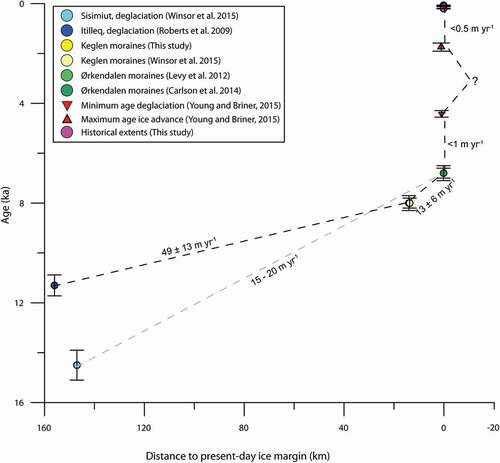
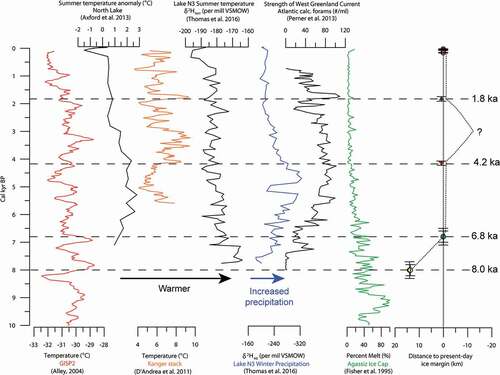
Figure 5. Records of Holocene climate conditions from Greenland and the Agassiz Ice Cap in Canada compared to a time-distance diagram of ice-margin fluctuations near Kangerlussuaq from 8 ka to the present. Horizontal dashed lines mark time constraints on ice-margin extents. The grey vertical line marks the present-day ice margin. The dotted line indicates our hypothesized ice-margin fluctuations at the study site. See for key of symbols