Figures & data
Figure 1. The Kangerlussuaq region indicating location of outwash plains, which are the main dust sources. The WMO station is located at the airport
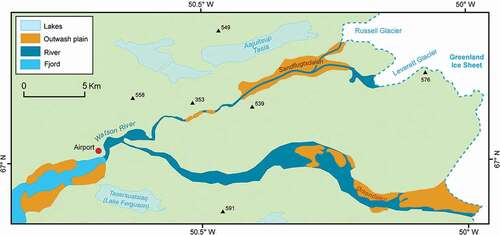
Table 1. World Meteorological Organization (WMO) weather codes relating to dust events
Figure 2. Dust entrainment from sediments at the head of the fjord near Kangerlussuaq, west Greenland, July 1, 2014. Photograph courtesy of Tom Matthews
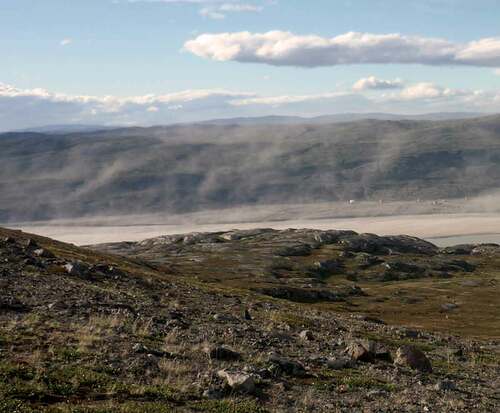
Figure 3. Seasonal variability of dust-event days at Kangerlussuaq (1945–2015)
Figure 4. Wind speed at the time of the first dust observation on each DED, averaged per month (1945–2015). Red bar indicates standard deviation. Number above each bar indicates the total number of DEDs in each month from 1945 to 2015
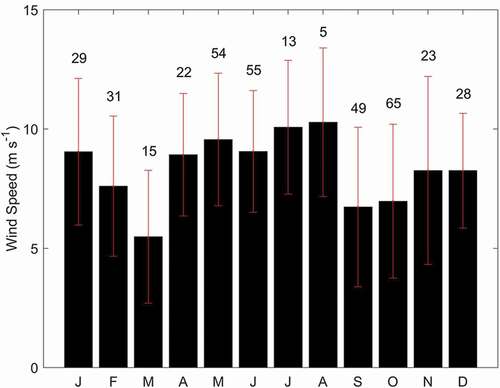
Figure 5. Seasonal variability in DEDs and selected variables affecting dust emission. Dust days = total number of DEDs per month (1945–2015). Average monthly snow cover (mm) and wind speed (m s−1) recorded at Kangerlussuaq (1945–2015). Modeled monthly precipitation data (see text for details). Average monthly discharge (1997–2013; Hasholt et al. Citation2013)
Figure 6. Monthly wind roses for all winds (1945–2015) recorded at Kangerlussuaq
Figure 7. Wind direction and speed calculated for DEDs only (1945–2015)
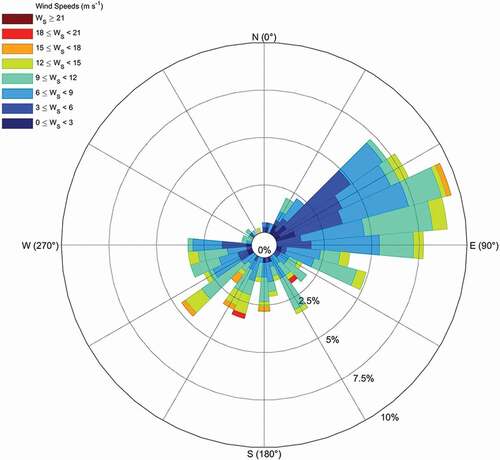
Figure 8. Trajectory line density (% trajectories per 0.5° × 0.5°cell) for twelve-hour HYSPLIT simulations run at 100 m start height using GDAS daily data for DEDs during 2008–2015
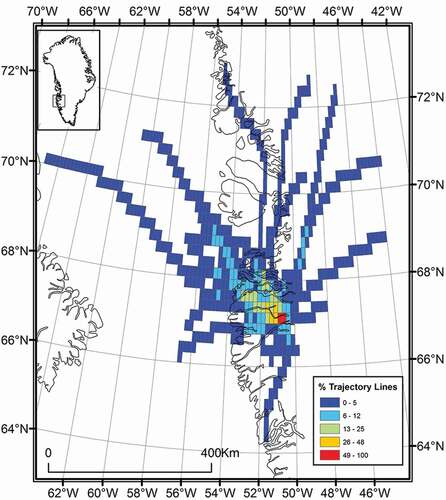
Figure 9. Trajectory line density (% trajectories per 1° × 1°cell) for seventy-two-hour HYSPLIT simulations run at 100 m start height using NCEP/NCAR data DEDs during 1993–2015
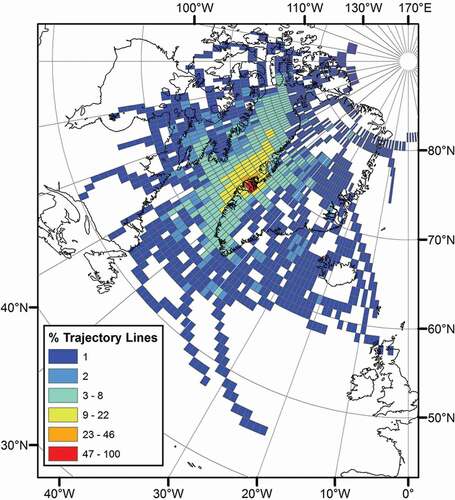
Figure 10. Trajectory point density (% per 1° × 1°cell) at different altitudes for seventy-two-hour HYSPLIT simulations run at 100 m start height using NCEP/NCAR data for DEDs from 2008 to 2015
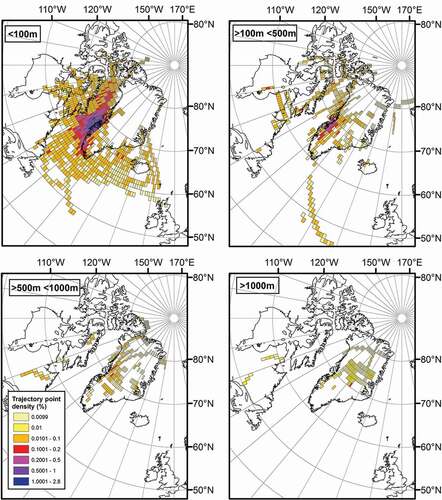
Figure 11. Annual total dust observations and DEDs for 1945–2015 recorded at Kangerlussuaq
Figure 12. (A) Average monthly wind speed for 1984 and 1985. Bars show average wind speed and standard deviation for all days. Dotted line is average monthly temperature; X indicates average wind speed for DEDs only. (B) Total DEDs per month for 1984 and 1985
Figure 13. Dust Storm Index calculated for 1973–2015