Figures & data
Table 1. Morphometric characteristics of EVV Upper lake (from Cadieux et al. Citation2016)
Table 2. Limnological properties for EVV Upper lake, including temperature, pH, dissolved oxygen (DO), dissolved organic carbon (DOC), and conductivity during summer 2014
Figure 1. Bathymetric map of EVV Upper lake (modified from Cadieux et al. Citation2016) indicating sampling sites for macrophytes and littoral sediments and profundal sediment core (triangle). Inset of Greenland marking Kangerlussuaq
Figure 2. Composition of pooled tissue samples from dominant macrophyte species: (A) organic carbon isotope value (δ13Corg) and (B) carbon-to-nitrogen ratio (C/N). Box plots include mean (small square inside box), median (horizontal line inside box), interquartile range (25th and 75th percentiles as box ends), minimum and maximum (vertical lines), and range from 1st to 99th percentile (X)
Figure 3. δ13Corg versus %OC for macrophyte tissues and surface sediments collected from littoral sampling sites. Macrophyte tissues for Eriophorum and Hippuris are presented separately for emergent, submergent, and root portions of each plant collected; for Warnstorfia the leaf/stem tissues were pooled for each sample
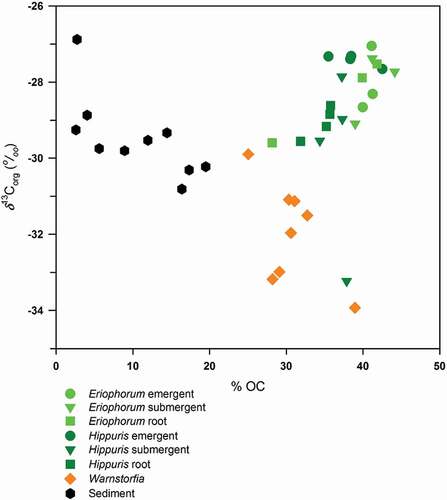
Figure 4. Sediment depth profile of δ13Corg, δ15N, %OC, %N, and C/N ratios for the 50 cm profundal sediment core
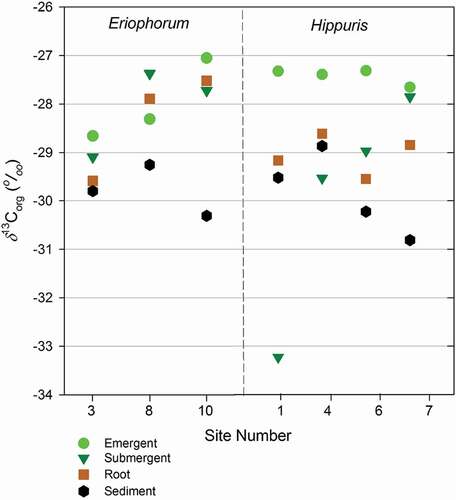
Figure 5. δ13Corg versus site number for Eriophorum- and Hippuris-dominated sites. Data are presented separately for emergent, submergent, and root portions of each plant and for surface sediments collected beneath