Figures & data
Figure 1. Map of the study area, with sites indicated over a WorldView2 satellite image from July 10, 2010. Inset map marks the study area (black rectangle) in west Greenland
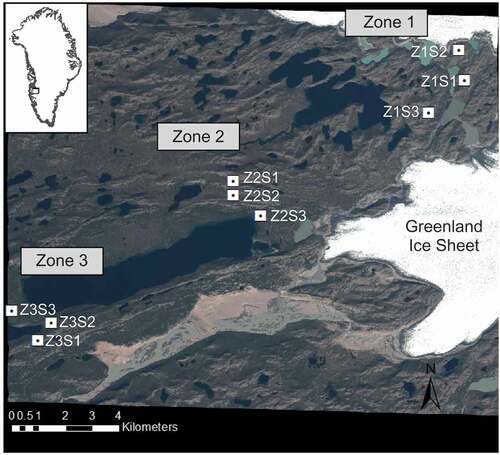
Table 1. Description of cover type used in land classification and field sampling
Table 2. Sample collection and measurement across the study sites. Vegetation types are shrub (SH), steppe (ST), grasslands (GL), mixed vegetation (MX), eroded soil (ES), and fen (FN)
Table 3. Error matrix comparing land cover classes from satellite classification with ground-based vegetation observations. Vegetation classes are shrub (SH), steppe (ST), grassland (GL), mixed vegetation (MX), eroded soil (ES), fen (FN), and water (W)
Table 4. Area, percent cover, carbon and nitrogen pools for each terrestrial land cover class. Area was extracted from the land cover classification. Pool sizes are mean values
Figure 2. Land cover classification map of the study area. Colors coincide with land cover classes, including the following vegetation classes: shrub, steppe, grassland, mixed vegetation, eroded soil, and fen
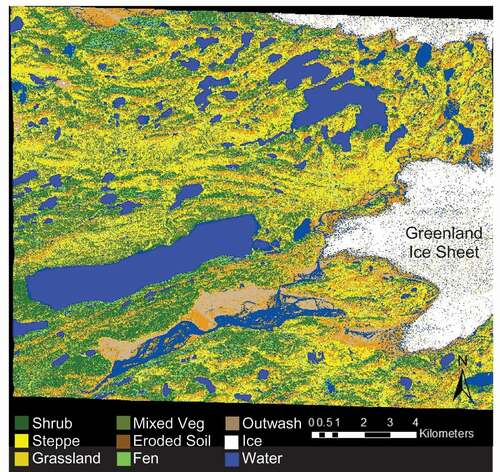
Figure 3. Thermal sums of (A) air and (B) soil temperatures at 5 cm depth in different vegetation types and in three zones. Data points mark site averages with error bars indicating ±1 standard error. Thermal sum of air temperature was calculated for one year (July 12, 2011–July 11, 2012), and soil temperature was calculated between July 17, 2011, and June 12, 2012. Shapes of soil thermal sums indicate vegetation cover (ES = eroded soil, ST = steppe, MX = mixed vegetation, SH = shrub)
Table 5. Comparison of models explaining soil thermal sums. The preferred model (ΔAICc < 2) contains an interaction between vegetation type and zone. Site was included as a random variable in all models. Marginal R2 of the best fitting model was 0.8116 (Veg = Vegetation)
Figure 4. Ordination biplot of the partial RDA of soil chemistry measurements using vegetation type and zone as the independent variables (). The centroid of each vegetation type is labeled for shrub (VegSH), mixed vegetation (VegHB), steppe (VegGR), grassland (VegGR2), eroded soil (VegDZ), and fen (VegLA). TOC is total organic carbon, Grav Moist is soil moisture, TN is total nitrogen, EC is electrical conductivity, and PH is pH. The biplot represents 31 percent of the total variance (25.4% on RDA1 and 7.6% on RDA2)
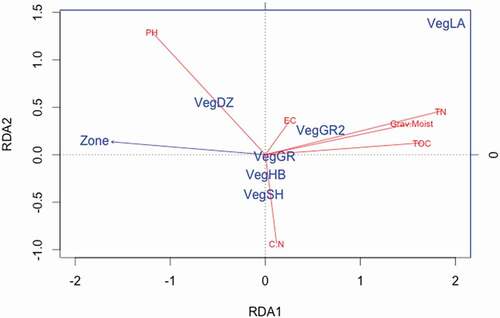
Table 6. Mean and range of soil chemistry measurements collected from six different vegetation types: N is the number of soil samples, %C is organic carbon content, %N is nitrogen content, SWC is soil water content (g H2O g Soil−1), and EC is electrical conductivity (micro-siemens cm−1)
Table 7. Comparison of models explaining soil organic carbon stocks. The top-ranked model, with vegetation as a main effect, is preferred. All other models, ΔAICc > 2
Figure 5. Soil (A) organic carbon and (B) nitrogen pools to a depth of 50 cm for soils from six vegetated land cover types in western Greenland (ES = eroded soil, ST = steppe, GL = grasslands, MX = mixed vegetation, FN = fen, SH = shrub). Horizontal tabs mark the mean of each vegetation type, with error bars that represent ±1 standard error of the mean. Gray data points are the carbon stocks from each soil pit. Different letters indicate significant differences in Tukey HSD post hoc test (P < 0.05)
Table 8. Comparison of models explaining soil nitrogen stocks. The top-ranked model, with vegetation as a main effect, is preferred. All other models, ΔAICc > 2
Figure 6. Average soil respiration rates in five vegetation types during the growing season. Error bars are ±1 standard error around the mean. Different letters indicate significant difference in Tukey HSD post hoc test (P < 0.05)
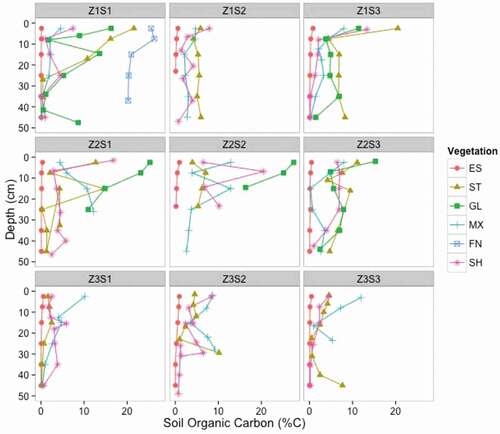
Figure 7. Soil organic carbon content (%) for each soil profile. Symbols correspond to the vegetation types (ES = eroded soil, ST = steppe, GL = grasslands, MX = mixed vegetation, FN = fen, SH = shrub). Profiles are grouped by sites in each panel, with Zone 1 sites in the top row, Zone 2 sites in the middle row, and Zone 3 sites in the bottom row