Figures & data
Figure 1. Location of the cryoconite holes used for in situ incubations, measurements, and sampling on the Greenland Ice Sheet at Point 660 (67.06000, −50.17000) on the ice sheet margins and at camp Black and Bloom (67.07482, −49.3586). Map is acquired as an image from Modis Satellite
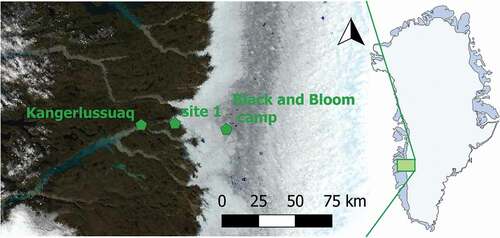
Figure 2. A custom-made incubation vessel, manufactured using 3D printing with sampling ports on the sides to enable measurement of oxygen, pH, and microbial community changes with depth
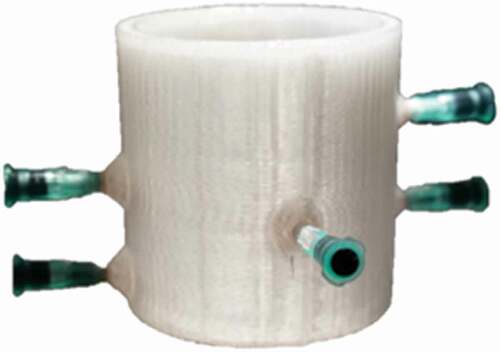
Figure 3. Microoptode positioned with a manual micromanipulator for in situ measurement of an oxygen profile in a cryoconite hole on the surface of the Greenland Ice Sheet
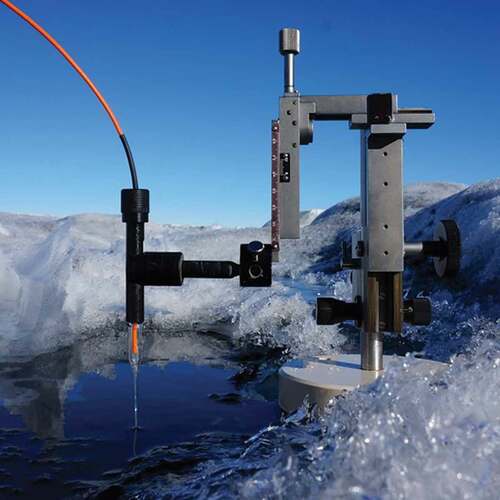
Figure 4. In situ oxygen profiles of varying morphologies of cryoconite sediments measured with a microoptode in a variety of cryoconite sediment accumulations. Note the different vertical scale on the graphs. (A) A classic cryoconite hole, with a regular, semicircular shape. Water depth was approximately 11 cm and sediment depth was approximately 4 mm. (B) Cryoconite sediment in an irregularly shaped hole, with a water depth of 1–7 cm and sediment depth of 1 cm. (C) A thick layer of cryoconite material (1.5 cm) without a layer of water
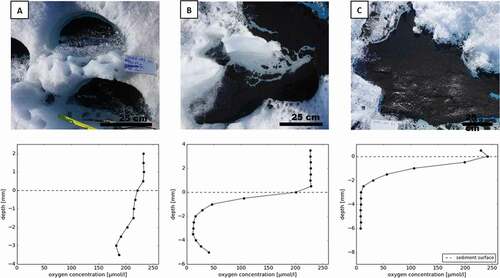
Figure 5. Oxygen profile measured using a microsensor within a 4 mm wide, spherical cryoconite granule
Figure 6. Temporal development of a characteristic oxygen profile in 10 mm thick cryoconite sediment after perturbation
Figure 7. Oxygen profiles of twenty-day open and closed cryoconite field incubations with calculated NEP. Error bars show standard deviation of triplicate bottle measurements of oxygen and standard error of NEP calculations
Figure 8. Oxygen profiles of long-term, closed laboratory incubations of cryoconite material at 0.2°C for more than four months with calculated NEP. Error bars show standard deviation of triplicate bottle measurements of oxygen, and standard error of NEP calculations
Figure 9. The pH profiles in the beginning and end of the long-term laboratory incubations, measured on the first day of incubations and then in dark and light vessels on day 116