Figures & data
Figure 1. (A) Location of study area in the south west of Greenland. (B) Transect of studied lakes extending to coast. (C) Map detailing most heavily sampled area and indicating which lakes were sampled for the Greenland Analogue Project and which were sampled by Dr. John Anderson. The study area is divided into three regions: ice marginal (area 1), upper fjord (area 2), and coastal (area 3). (A) and (B) are adapted from Anderson and Brodersen (Citation2001)
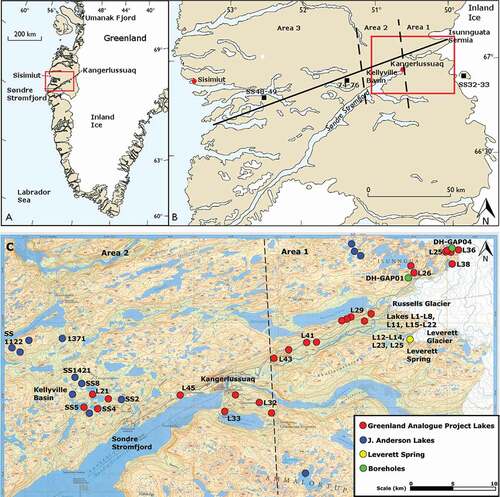
Table 1. Summary of major geochemical and isotopic results. Alkalinity is expressed as mmol/L as CaCO3. Meltwater lakes, lakes that receive meltwater directly, and the thaw lakes on the Leverett Glacier till plain are separated here to illustrate the similarity between these two groups
Table 2. Summary of representative chemistry and isotopic results. P = pond, DL = dilute lake, SL = saline lake, and MW = meltwater lake. *Indicates that the results for dissolved chemical species are average results throughout multiple years as measured by John Anderson (ex., Anderson et al. Citation2001). Alkalinity is expressed as mg/L as CaCO3. NM = not measured
Figure 2. (A) Isotopic composition of lakes. Local evaporation lines are adapted from Leng and Anderson (Citation2003) for zones 3 (mid fjord), 4 (upper fjord), and 5 (close to ice sheet). The zones from Leng and Anderson (Citation2003) correspond to area 3 (zone 3), area 2 (zone 4), and area 1 (zone 5). Average annual precipitation estimated from intercept of LEL with GMWL. Local meteoric water lines for Grönnedal and Thule were generated using isotopic monitoring data from IAEA stations. (B) Isotopic composition of lakes compared to groundwaters and meltwaters from Kangerlussuaq region
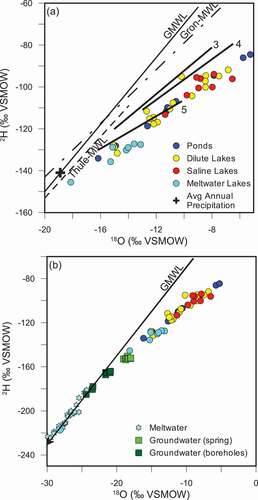
Table 3. Results of δ37Cl and δ81Br analyses on lakes and borehole groundwaters. Analytical uncertainty on δ37Cl and δ81Br is ±0.2‰. Locations with * next to the name indicate average lake chemistries. NM = not measured
Table 4. Isotopic composition and concentration of sulfate in surface waters and groundwaters. Sulfate minerals (predominantly gypsum) from fracture infillings and sulfide minerals from the rock matrix are included from the DH-GAP01 and DH-GAP04 cores. Gypsum was found abundantly as a fracture filling below a depth of 300 m in the DH-GAP04 borehole, while only one occurrence of gypsum was noted in the DH-GAP01 borehole. NM is not measured because of insufficient sample material. NA = not applicable
Figure 3. (A) δ37Cl compared to δ18O isotopic composition. δ81Br values compared to (B) δ18O isotopic values and (C) δ37Cl isotopic values. Analytical error corresponds to symbol size except where otherwise indicated by error bars
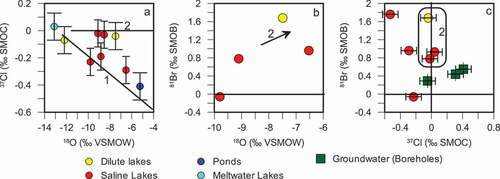
Figure 4. Relationship between Na/Ca ratios compared to Cl/SO4 ratios indicates the relative importance of processes such as sulfate reduction, sulfide oxidation, and CaCO3 precipitation
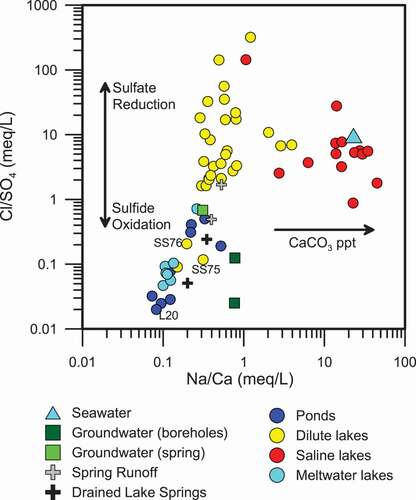
Figure 5. The 87Sr/86Sr signature of lakes increases toward the ice sheet where weathering of biotite becomes increasingly important
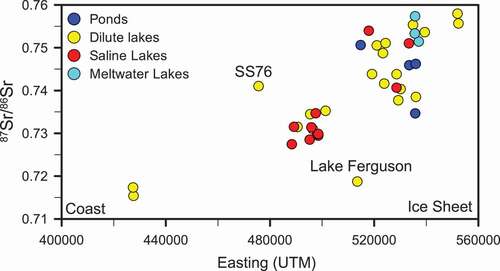
Figure 6. Comparison of the ratio of (Mg + K)/Na to 87Sr/86Sr isotope ratios for all lake types. The ratio of (Mg + K) to Na increases with increasingly radiogenic 87Sr/86Sr isotopic ratios
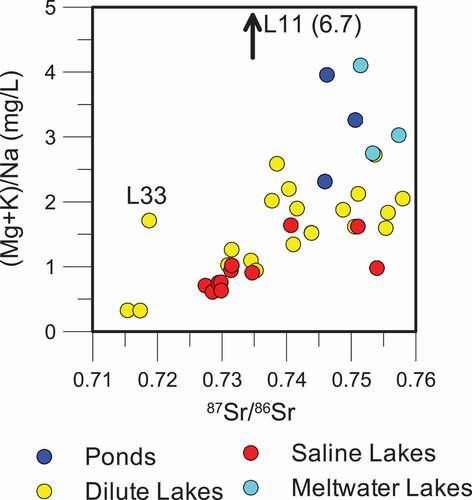
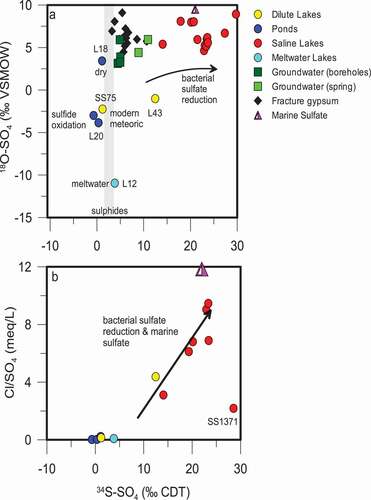
Figure 7. (A) the isotopic composition (δ34S and δ18O) of sulfate in lakes and groundwaters as well as gypsum found as a fracture mineral in the bedrock. δ34S of sulfide minerals found in the bedrock are indicated by the stippled area. (B) A comparison of the δ34S of sulfate in lakes to the Cl/SO4 ratio shows that as δ34S is enriched during bacterial sulfate reduction, sulfate is removed and the Cl/SO4 ratio increases