Figures & data
Figure 1. Location of Leverett Glacier. (A) Landsat image indicating the configuration of the Greenland Ice Sheet in the Leverett Glacier region (red box is panel B). (B) ArcticDEM, showing the elevation and structure of Leverett Glacier. The current location of the meltwater portal is indicated by a yellow star. Note the broad depression tracking northeast up-ice from the portal location
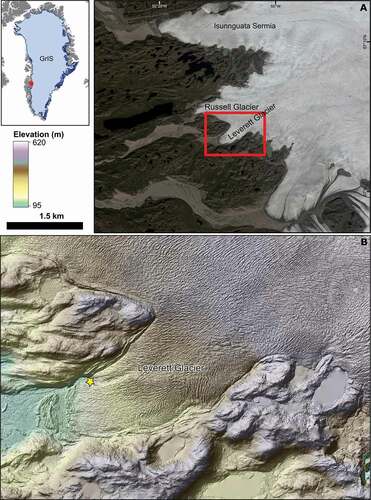
Figure 2. (A) Lightweight and highly portable Groundvue7 ground-penetrating radar, with operator fore of the radar. The radar transmitter, the dipole antenna enclosed within ruggedized tubing, and the glacier-travel safety rope are shown. Note the undulating nature of the ice surface (photo: Neil Ross, April 5, 2015). (B) Ice marginal meltwater portal at Leverett Glacier. Note the surface depression extending up-ice from the portal (photo: Andrew Sole, September 24, 2016)
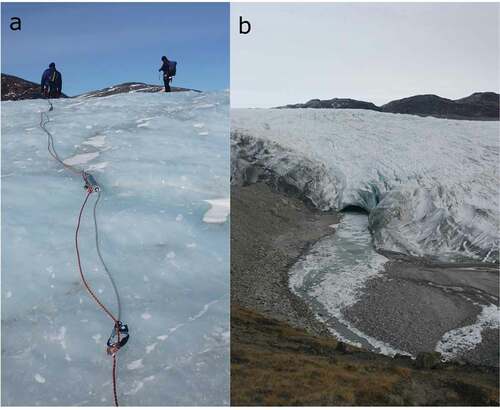
Figure 3. Location map of radar data acquisition, Leverett Glacier. Ice thickness shown as colored points, with hillshaded ArcticDEM to illustrate surface roughness and crevassing. Inset shows existing airborne ice-penetrating radar survey lines acquired by CReSIS/Operation IceBridge across the Russell and Leverett Glaciers. Red box shows extent of primary map
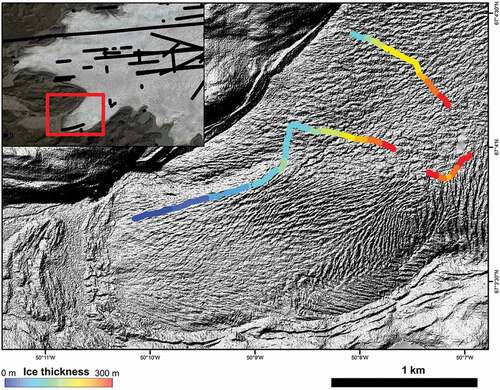
Figure 4. Ground-penetrating radar data from the marginal zone of Leverett Glacier. (A) Raw unprocessed data; (B) data after processing (bandpass filter [0–20 MHz], gain, trace stacking, mean filter, background removal); and (C) data after processing, with manual picking of the bed reflection in red. Red arrow shows location of bright subice bed reflection. The radargrams are 4 km long. Because of the large vertical uncertainties associated with the GPS systems used when logging the radar data, these radargrams are not presented with a vertical correction
![Figure 4. Ground-penetrating radar data from the marginal zone of Leverett Glacier. (A) Raw unprocessed data; (B) data after processing (bandpass filter [0–20 MHz], gain, trace stacking, mean filter, background removal); and (C) data after processing, with manual picking of the bed reflection in red. Red arrow shows location of bright subice bed reflection. The radargrams are 4 km long. Because of the large vertical uncertainties associated with the GPS systems used when logging the radar data, these radargrams are not presented with a vertical correction](/cms/asset/b6af4628-9629-4dd3-944c-1d71583fe1c7/uaar_a_1420949_f0004_oc.jpg)
Figure 5. BedMachine ice thickness product (A) without and (B) with our ice-thickness measurements derived from ground-based GPR data. The colored dots are the radar-derived ice thicknesses at the same color scale for comparison
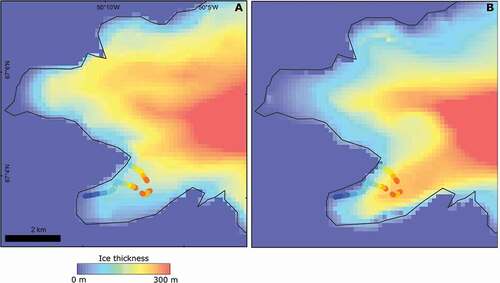
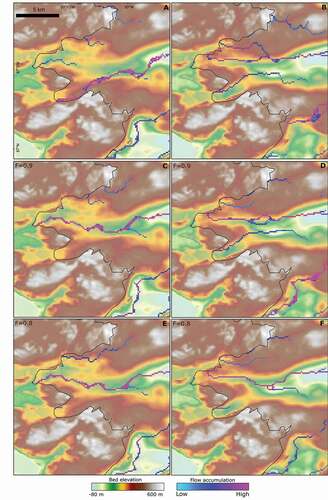
Figure 6. Hydropotential routing of subglacial water based on BedMachine ice thickness product (A) without and (B) with our ice-thickness measurements incorporated for F = 1; (C) without and (D) with our ice-thickness measurements incorporated for F = 0.9; and (E) without and (F) with our ice-thickness measurements incorporated for F = 0.8