Figures & data
Table 1. Lake characteristics and sampling information. The only samples collected in 2016 were Chl a for the three indicated GF lakes and surface sediments from GL6. Surface sediments were used for both diatom counts and Psenner extractions
Figure 1. Map of study area, showing the locations of lakes relative to the Greenland Ice Sheet. Glacially fed (GF) lakes are indicated in light blue, and snow- and groundwater-fed (SF) lakes are dark blue
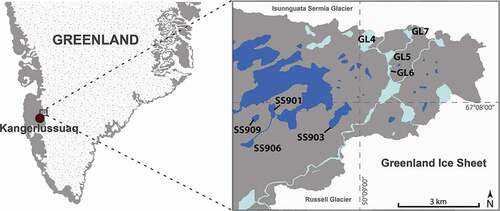
Figure 2. Physical and chemical properties of glacially fed (GF) and snow- and groundwater-fed (SF) lakes. Significant differences are indicated by *** (p < 0.001), ** (p = 0.001–0.01), or * (p = 0.01–0.05)
Figure 3. Principal component analysis (PCA) plot of physical and chemical properties of glacially fed (GF) and snow- and groundwater-fed (SF) lakes. GF lakes are labeled in red, SF lakes in black, and environmental variables in blue
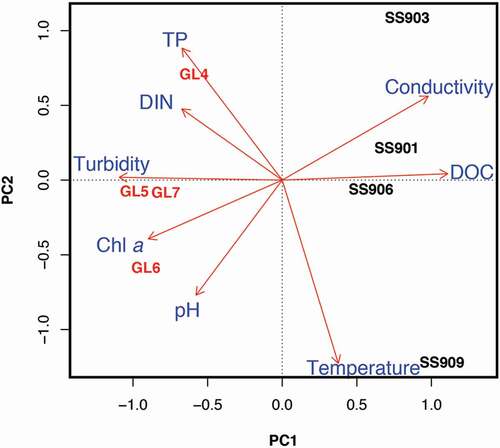
Figure 4. Sequential sediment extractions for aluminum (Al; A–E), iron (Fe; F–J), and phosphorus (P; K–O) from glacially fed (GF) and snow- and groundwater-fed (SF) lake sediments. Significant differences are indicated by *** (p < 0.001), ** (p = 0.001–0.01), or * (p = 0.01–0.05)
Figure 5. Ratios of glacially fed (GF) and snow- and groundwater-fed (SF) lake sediment extractions. Phosphorus (P) release from sediments during anoxia is predicted if aluminum to iron (Al:FeNH4Cl+BD+NaOH) is below 3 and if aluminum to phosphorus (AlNaOH:PNH4Cl+BD) is below 25
Figure 6. Principal component analysis (PCA) plot of sequential extractions from glacially fed (GF) and snow- and groundwater-fed (SF) lake sediments. GF lakes are labeled in red, SF lakes in black, and extraction variables in blue. Percent organic matter = %OM
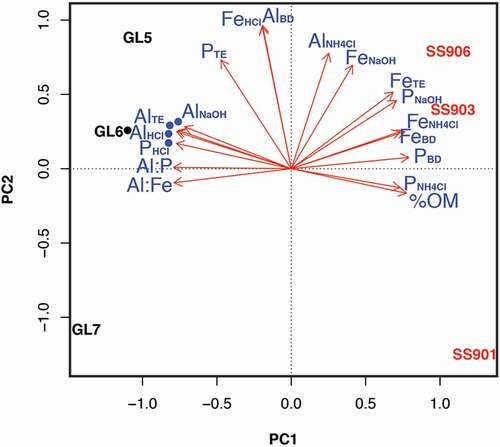
Table 2. Microbial extracellular enzyme activities (EEAs) of glacially fed (GF) and snow- and groundwater-fed (SF) lakes. EEA units are μmol mL−1 h−1. Significant differences (p ≤ 0.05) between lake types are indicated by an asterisk (*)
Figure 7. Chlorophyll a (Chl a) as a measure of algal biomass (a) and average diatom species richness, determined by rarefaction analysis (b). Significant differences are indicated by *** (p < 0.001), ** (p = 0.001–0.01), or * (p = 0.01–0.05)
Figure 8. Canonical correspondence analysis (CCA) plot of diatom species distribution (right panel) across glacially fed (GF) and snow- and groundwater-fed (SF) lakes (left panel), determined by nutrient and turbidity variables (middle panel). Turb = turbidity and Cond = conductivity