Figures & data
Figure 1. Floodplain dust entrained by wind, Kangerlussuaq. Photo credit: Rachel Fowler
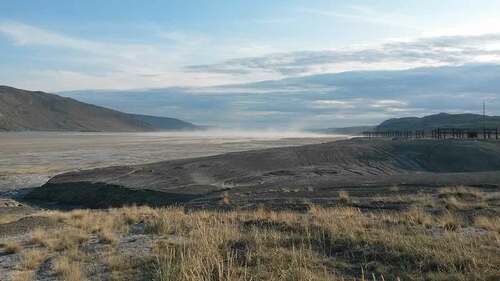
Figure 2. Conceptual diagram illustrating potential chemical (photodegradation), biological (bacterial consumption), and physical (flocculation and precipitation) pathways for DOC loss in surface waters. Interactions between dust and solar radiation may lead to DOC loss via photoflocculation, and interactions between solar radiation and bacterial activity could have variable effects. Note that pathways are not exclusive of each other (i.e., DOC loss could occur via multiple pathways)
Table 1. Characteristics of the three study lakes. DOC, pH, and temperature measurements were taken from lake epilimnia in June 2015. Nutrient data are from June–July 2013. a.s.l. = above sea level
Figure 3. Study area. SS2, SS1381, and SS901 denote the locations of experimental lakes
Table 2. Mean percent change in DOC concentration and quality metrics for dust addition + light and bacterial activity + light experiments. The dust addition experiment for soil water was incubated in dark conditions only
Table 3. The p values for dust addition + light exposure and bacterial activity + light exposure experiments. Bold values represent a significance level less than 0.05. Nonsignificant (p ≥ 0.10) interaction terms were removed from statistical models. The dust-addition experiment for soil water was incubated in dark conditions only
Figure 4. Results of Lake SS2 soil-water exposure to dust addition on SUVA254, S275–295, and [DOC], represented by percent change (n = 3)
![Figure 4. Results of Lake SS2 soil-water exposure to dust addition on SUVA254, S275–295, and [DOC], represented by percent change (n = 3)](/cms/asset/dd905106-024c-46cb-8013-f23574029d93/uaar_a_1436815_f0004_b.gif)
Figure 5. Results of SS2, SS1381, and SS901 lake-water exposure to dust addition and light on SUVA254, S275–295, and [DOC], represented by percent change (n = 3)
![Figure 5. Results of SS2, SS1381, and SS901 lake-water exposure to dust addition and light on SUVA254, S275–295, and [DOC], represented by percent change (n = 3)](/cms/asset/1d37d663-6a3c-457d-bcc8-c1dcf79e1f25/uaar_a_1436815_f0005_b.gif)
Figure 6. Results of SS2, SS1381, and SS901 lake-water exposure to bacterial activity and light on SUVA254, S275–295, and [DOC], represented by percent change (n = 3). F = filtered treatments, I = inoculated treatments
![Figure 6. Results of SS2, SS1381, and SS901 lake-water exposure to bacterial activity and light on SUVA254, S275–295, and [DOC], represented by percent change (n = 3). F = filtered treatments, I = inoculated treatments](/cms/asset/41c52e2c-4492-4de8-949d-01acdc4529cd/uaar_a_1436815_f0006_b.gif)
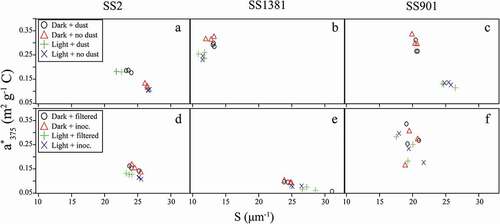
Figure 7. S versus a*375 for dust + light (A–C) and bacteria + light (D–F) experiments (n = 3)