Figures & data
Figure 1. Map of the three study areas (marked as 1, 2, and 3) located in southwestern Greenland in relation to the Greenland Ice Sheet, the coast near Sisimiut, and the climatic gradient (maritime at the coast and continental inland), which is present in this region
Table 1. Technical details of the imagery used, including date obtained, satellite, spatial resolution and image code. Also listed are the sensor types including Thematic Mapper (TM), Enhanced Thematic Mapper (ETM), Operational Land Imager (OLI), and Advanced Spaceborne Thermal Emission and Reflection Radiometer (ASTER)
Table 2. Table displaying the change in the surface area of lakes (>40 ha) from the study region by area (1, 2, and 3) in 1995, 2002, 2015, 2016, and 2017, and the net surface-area change (km2, m2, and %) between 1995 and 2017
Figure 2. Map showing the lakes that have not changed in surface area (yellow), have increased in surface area (green), and have decreased in surface area (red) in area 1 between 1995 and 2017. The black square highlights the four closed-basin lakes that increased in lake surface area
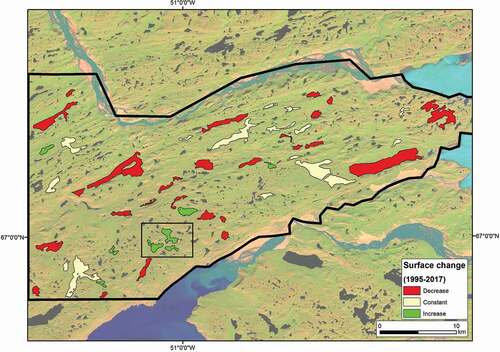
Figure 3. Map showing the lakes that have not changed in surface area (yellow), have increased in surface area (green), and have decreased in surface area (red) in area 2 between 1995 and 2017
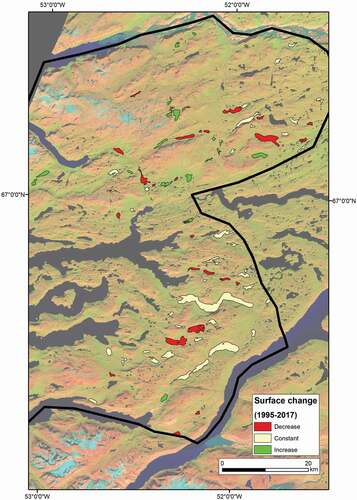
Figure 4. Map showing the lakes that have not changed in surface area (yellow), have increased in surface area (green), and have decreased in surface area (red) in area 3 between 1995 and 2017
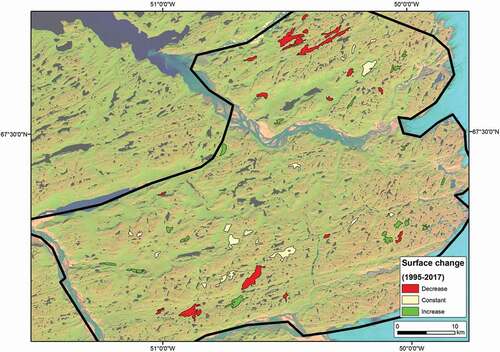
Figure 5. Net changes in lake surface area in m2 for areas 1, 2, 3, and the entire region between 1995 and 2017 (total)
Figure 6. Number of lakes that demonstrated an increase (black), decrease (grey), and no change (white) in lake surface area between 1995 and 2017 for areas 1, 2, and 3. Also displayed above each bar are the change as a percent of the total area and change in m2
Figure 7. The direction of change in lake surface area in m2 and percent for each area (1, 2, and 3) for 1995–2002 (95–02), 2002–2015 (02–15), 1995–2015 (95–15), 2015–2016 (15–16), 2016–2017 (16–17), and 1995–2017 (95–17). Black represents net change, dark grey represents the decrease, and light grey represents the increase
Figure 8. The net change in lake surface area of lakes in area 1 (black circle), area 2 (grey circle), and area 1 (white circle) by lake location (longitude) in the regional study area between 1995 and 2017
Figure 9. The mean summer (June, July, and August) temperature (T°C) and precipitation (mm) for Kangerlussuaq from 1994 to 2016. Also presented are the net changes in surface area (m2) for the three areas used in the study (area 1 as black, area 2 as grey, and area 3 as white bars) for the time periods 1995–2002 (95–02), 2002−2015 (02–15), 2015–2016 (15–16), 2016–2017 (16–17), and 1995–2017 (95–17). Temperature and precipitation data are taken from Cappelen (Citation2017)
Figure 10. Net change in lake surface area (m2) plotted against lake surface area (m2) for area 1 (black circle), area 2 (grey circle), and area 3 (white circle) for the study region
Figure 11. The net change in lake surface area (m2) plotted against lake:catchment area ratio for area 1 (black circle), area 2 (grey square), and area 3 (triangle) for the time periods 1995–2002, 2002–2015, 2015–2016, 2016–2017, and 1995–2017