Figures & data
Table 1. Overview of DEMs used in this study. Base file refers to the main satellite scenes that were used to establish the strips of the ArcticDEM used in this study
Figure 1. The Holm Land Ice Cap as seen from Sentinel-2 (ESA) on August 26, 2016. The approximate outlines of the peninsula are overlain with glacier outlines modified from the Greenland glacier inventory by Rastner et al. (Citation2012). The largest glaciers are numbered according to their identification in the Randolph Glacier Inventory (RGI Consortium Citation2017)
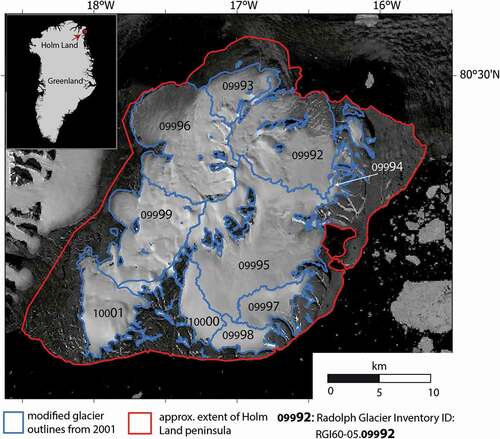
Figure 2. Analysis of artifacts in the AeroDEM. (a) Elevation-change grid (Δh, ArcticDEM minus AeroDEM) with step-wise changes in Δh highlighted in red and numbered transects. (b) Transects of the Δh grid with values indicated at the sudden Δh changes
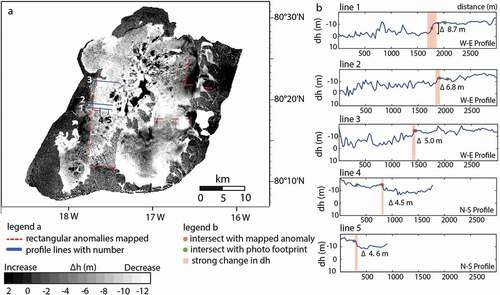
Table 2. Shifts between DEMs as suggested by automated co-registration. Shifts are given in meters and in the format (dx|dy|dh)
Table 3. Mean elevation change over the Holm Land Ice Cap between 1978 and 2012–2015. Mean elevation changes are given excluding all areas of data voids and for two void-filling approaches
Figure 3. Elevation changes over the Holm Land Ice Cap as calculated from subtracting AeroDEM (1978) from ArcticDEM (2012–2015), using two different interpolation methods for void filling. Enlarged details show differences over void-filled areas
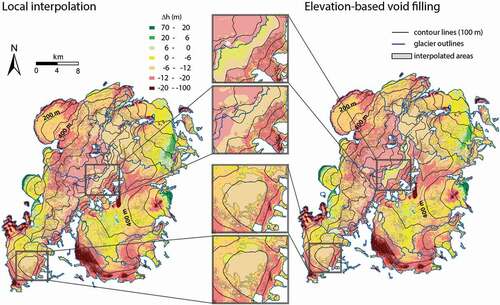
Table 4. Individual elevation change at the ten major glaciers that cover 98 percent of the Holm Land Ice Cap and the respective random error
Figure 4. Hypsometry (from ArcticDEM) and the mean elevation change between AeroDEM (1978) and ArcticDEM (2012–2015) per 100 m elevation bins for the largest eight glaciers and the entire ice cap (bottom right, gray shading). Error bars indicate one standard deviation. For glacier numbering refer to
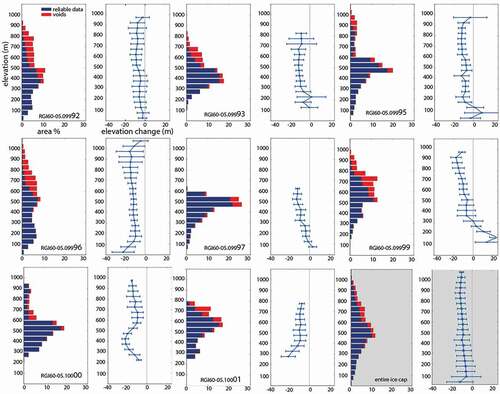
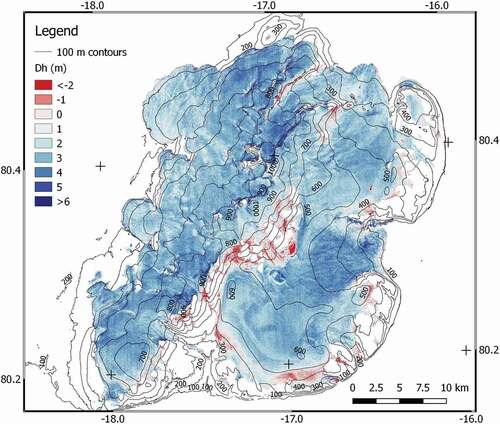
Figure 5. Elevation differences over the Holm Land Ice Cap calculated from subtracting TanDEM-X (2010–2014) from ArcticDEM (2012–2015)