Figures & data
Figure 1. Views of the human footprint on the Arctic Coastal Plain of northern Alaska in winter (A) and summer (B).
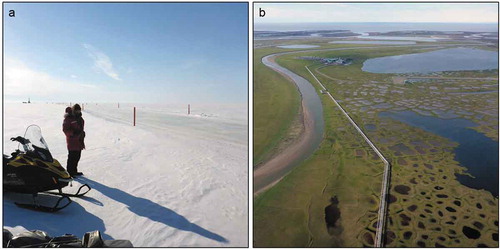
Figure 2. Physiographic, cultural, and land-management features of the North Slope of Alaska. Lakes are shown in blue and the Fish Creek Watershed is outlined in yellow.
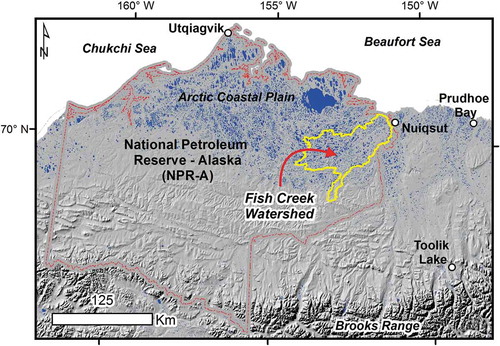
Figure 3. Lake water extracted in the northeastern NPR-A (approximately 70,000 ha land area) during the winters from 2008–2009 to present (2017–2018) as reported by ConocoPhillips-Alaska Inc. (CPAI) to the Bureau of Land Management’s Arctic District Office.
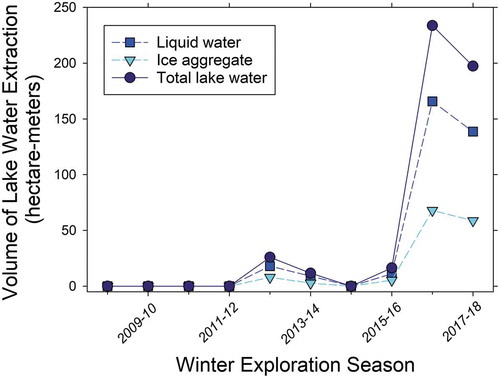
Figure 4. Historic (1950–2014) and projected (2015–2100) changes in summer precipitation (A) and winter air temperature (B) for the Fish Creek Watershed using a regional climate model Polar WRF (Weather Research and Forecasting; Cai et al. Citation2018a). Historic normal (control year) and extreme drought and wet summers (A) and cold and warm winters (B) are used for creating scenarios to evaluate freshwater habitat responses.
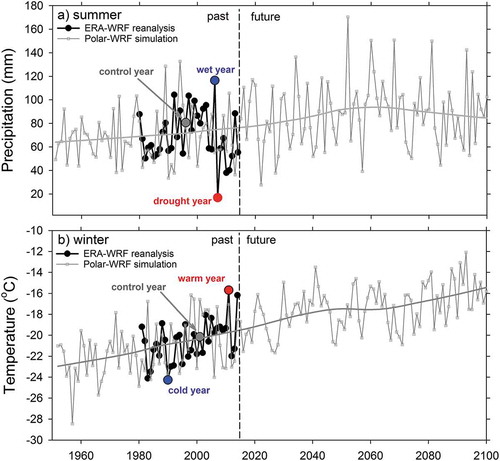
Table 1. Comparison of lake-water supply and habitat characteristics among regions of the North Slope of Alaska including in the Fish Creek Watershed. The proportion of floating ice is based on a twenty-five-year (1992–2016) late-winter analysis using synthetic aperture radar (Engram et al. Citation2018) and maximum ice thickness is based on measured (Arp et al. Citation2018) and simulated values (Cai et al. Citation2018a).
Figure 5. The Beaufort Sea early winter sea-ice extent correlates with the floating-ice area of freshwater lakes (Surdu et al. Citation2014), linking changes in the marine system to freshwater habitat dynamics on the Arctic Coastal Plain of northern Alaska (after Alexeev et al. Citation2016).
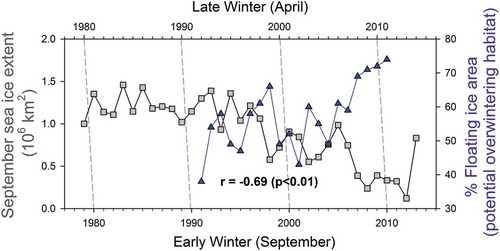
Figure 6. Views of the Crea Creek Watershed in the summer from high-resolution aerial photography (A); in the winter from synthetic aperture radar (SAR), showing bedfast- and floating-ice lakes (B); and classification of freshwater habitats using a combination of SAR, other remotely sensing analysis, and field studies (C) (after Jones et al. Citation2013).
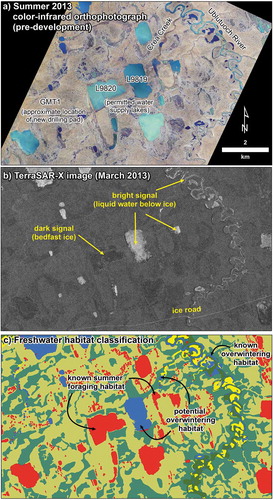
Figure 7. Examples of key organisms making up the freshwater food web of the Arctic Coastal Plain of northern Alaska. Photo credits: Hannah Uher-Koch (A), Matthew Whitman (B), Thomas Renicker (C), and Jason McFarland (D).
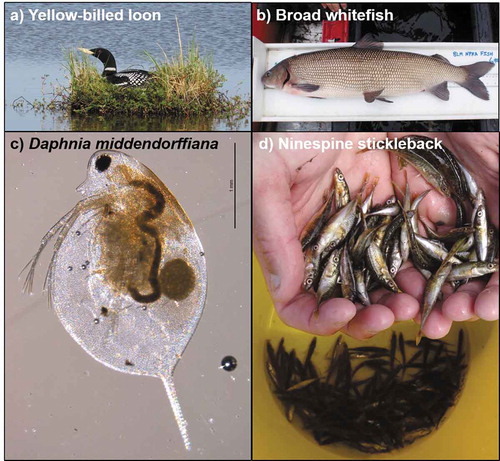
Figure 8. Examples of the scales at which winter water withdrawal from lakes and freshwater habitats can be managed using a Winter Water Supply Index based on a lake habitat classification system for the Fish Creek Watershed (Jones et al. Citation2017).
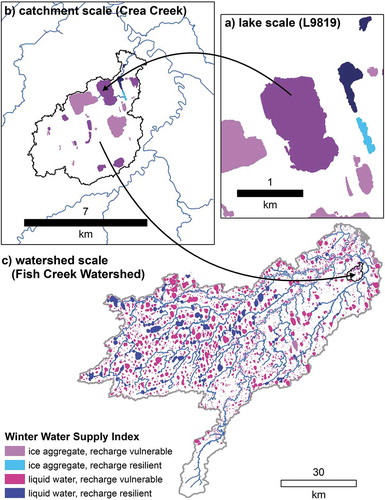
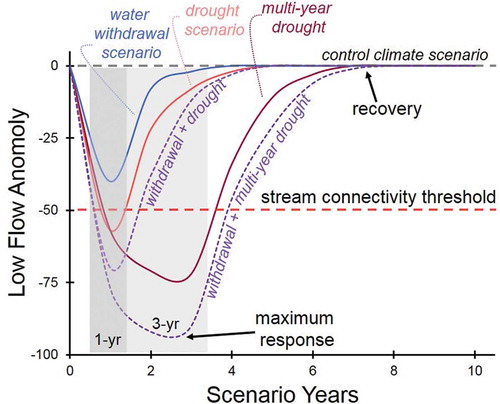
Figure 9. Example of freshwater habitat response (stream–lake system) to scenarios of drought, water withdrawal, and their combined effects on streamflow relative to a control climate scenario (based on Gädeke et al. Citation2016).