Figures & data
Table 1. Morphometric, water quality, and visually estimated vegetation characteristics of natural lakes and gravel-pit lakes sampled along the Dempster Highway in August 2017. SD = standard deviation.
Figure 1. Map of lakes sampled along the Dempster Highway between Fort McPherson and Inuvik, Northwest Territories.
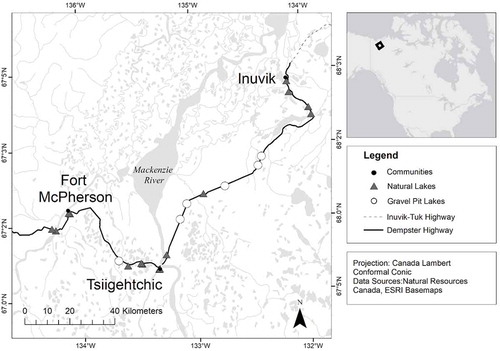
Table 2. Results of Welch’s t tests comparing selected water-quality and physical variables. t tests were conducted only for variables associated with our three hypotheses. The Bonferroni p value is corrected for eight tests. df = degree of freedom.
Figure 2. Comparison of selected morphometric and water-quality variables between natural and gravel-pit lakes. Bolded line = median; lower end of box = first quartile; upper end of box = third quartile; whiskers = range of data; dots = outliers.
Figure 3. Principal component analysis (PCA) conducted with morphometry and water-quality data for each of our twenty-one study lakes. Circles represent gravel-pit lakes and triangles represent natural lakes. Sites that are closer together tend to have similar morphometry and water quality than sites that are farther apart. The angle between the arrows reflects the correlation between predictor variables. Gravel pits tend to cluster in the upper-left quadrant of the PCA, indicating that they are deeper, clearer (high Secchi depth, low turbidity), smaller in area, and have low nutrient concentrations.
Figure 4. Comparison of rarefied species richness, diversity (Hill numbers), and abundance of zooplankton and macroinvertebrates in natural lakes and gravel-pit lakes.
Figure 5. Results of redundancy analyses displaying predictor variables (morphometry and water quality) with zooplankton (A) and macroinvertebrate (B) abundances as response variables. Circles represent gravel-pit lakes, triangles represent natural lakes. Species are represented by their text labels. Morphology and water-quality variables are represented by arrows. Sites that are closer together in the ordination plot have similar species composition than sites that are further apart.