Figures & data
Figure 1. The study area with sampling sites on the Brøgger Peninsula, located in the northwestern part of the Island of Spitsbergen (Svalbard Archipelago).
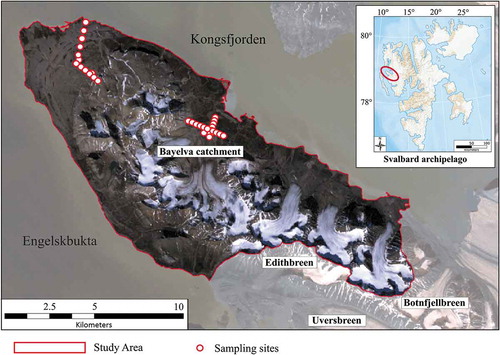
Figure 2. Typical land cover and landform classes on the Brøgger Peninsula (Svalbard). Land cover classes: the term “vegetated area” is used to group all vegetated land cover classes together: fen tundra (a), dense shrub moss tundra (b), patchy shrub moss tundra, and sparse shrub moss tundra (c). The fraction of the land surface covered with vegetation is within the range 95–100 percent for fen tundra, 75–95 percent for dense shrub moss tundra, 25–75 percent for patchy shrub moss tundra, and 5–25 percent for sparse shrub moss tundra. The fraction of the land surface covered by vegetation is less than 5 percent for the land cover classes: bare glacial fluvial sediment (d), barren gravel (e and f), and shallow open water. Landform classes: both solifluction lobes and solifluction sheets are grouped under “solifluction slopes” (a and b), sandur (d), patterned ground (e), and colluvial fans (f).
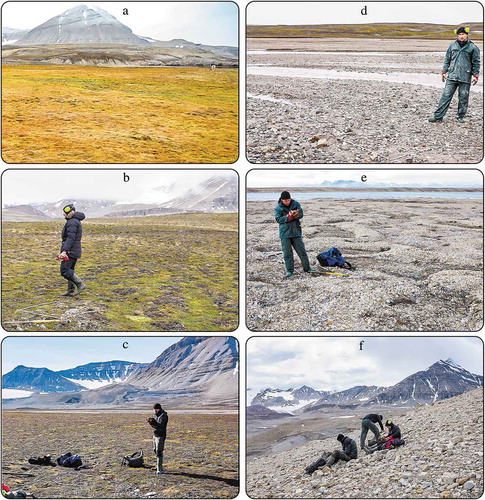
Table 1. Mean SOC storage and site characteristics for land cover classes on the Brøgger Peninsula (Svalbard).
Figure 3. Land cover classification of the Brøgger Peninsula (Svalbard).
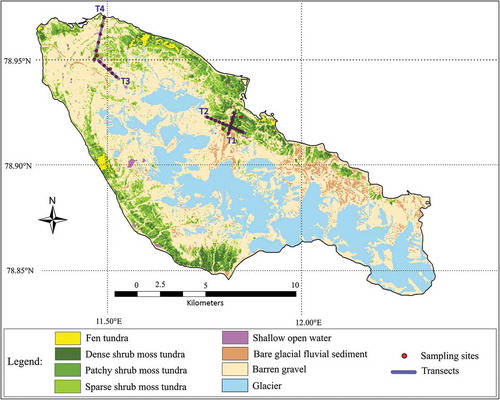
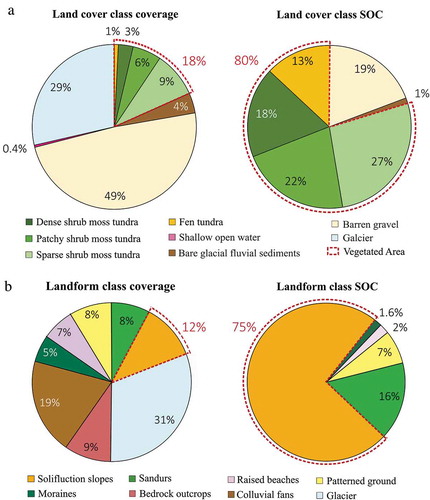
Figure 4. Proportion of area and vertical SOC allocation in each land cover class of the Brøgger Peninsula (Svalbard).
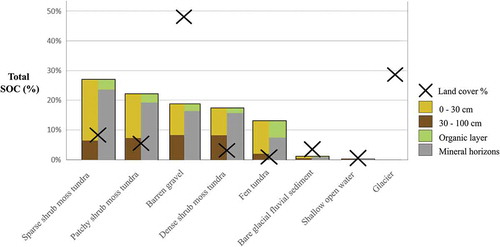
Table 2. Mean SOC storage and site characteristics for landform classes on the Brøgger Peninsula (Svalbard).
Figure 5. Landform classification of the Brøgger Peninsula (Svalbard), adapted from Joly (Citation1969).
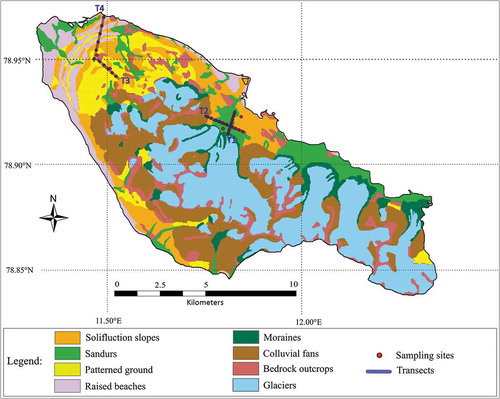
Figure 6. Proportion of area and vertical SOC allocation in each landform class of the Brøgger Peninsula (Svalbard).
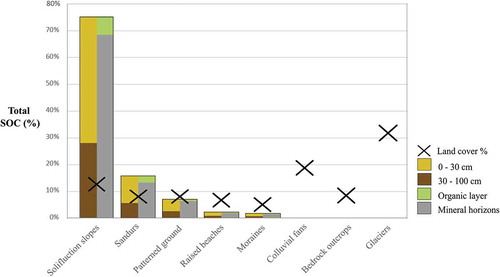
Table 3. Statistical summary of geochemical and elemental analyses.
Figure 7. Results of the geochemical analyses of soil samples of the Brøgger Peninsula. The fine fraction bulk density (a) was plotted using all of the 180 samples collected. The percentage of organic carbon (b), the C/N weight ratio (c), and the isotopic composition of δ13C were plotted using the seventy-two samples analyzed, using an Elemental Analyzer.
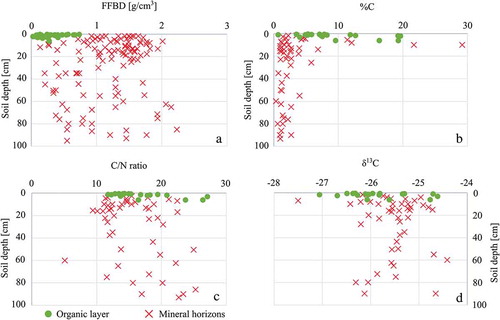
Table 4. Radiocarbon dating results.
Figure 8. Proportion of area and total SOC 0–100 cm storage for land cover (a) and landform (b) classes on the Brøgger Peninsula (Svalbard).