Figures & data
Table 1. Environmental conditions during CO2 flux measurement in 2015. Mean ± SD, n = 6 plots in each community.
Table 2. Partitioning of growing season daytime ecosystem respiration (ER) and gross photosynthesis (GP) into aboveground and belowground respiration (R) and net ecosystem exchange (NEE) in three arctic-alpine communities, expressed as mean CO2 flux (μmol m−2 s−1) and as mean proportion of ER (%ER) or GP (%GP), based on adjusted estimates (n = 6).
Figure 1. Total CO2 fluxes in three arctic-alpine plant communities calculated from raw measurements and after adjustment for anomalous measurements and differences in temperature and light conditions during measurement. Mean ± standard deviation of six plots per community.
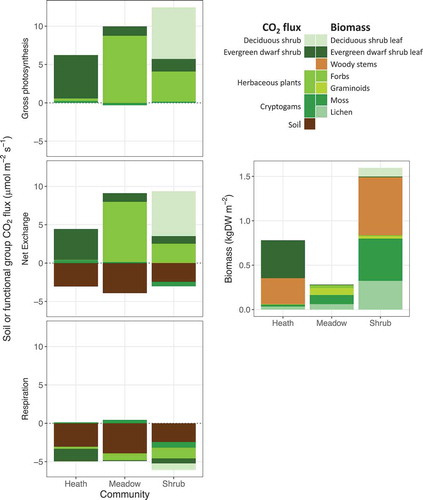
Figure 2. a–c: Adjusted soil and functional group contributions to ecosystem CO2 fluxes in three arctic-alpine plant communities based on sequential harvest and closed-system measurements in light and dark after removal of each functional group. d: Functional group biomass, with deciduous and dwarf shrub leaf and woody stem biomass separated and herbaceous plants and cryptogams divided into subgroups. Means of six plots per community, including null values for plots where a functional group was absent.