Figures & data
Figure 1. Directed acyclic graph (DAG) of a general hierarchical model structure, with data model given by [Z | Y, θ1], process model by [Y | θ2], and parameter prior model by [θ1] and [θ2]. Circles represent stochastic nodes, which may be observed, so that they are data, or unobserved, and therefore are latent processes; arrows denote stochastic dependence. Notice that arrows are unidirectional, and there is no cyclic pathway included in the graph.
![Figure 1. Directed acyclic graph (DAG) of a general hierarchical model structure, with data model given by [Z | Y, θ1], process model by [Y | θ2], and parameter prior model by [θ1] and [θ2]. Circles represent stochastic nodes, which may be observed, so that they are data, or unobserved, and therefore are latent processes; arrows denote stochastic dependence. Notice that arrows are unidirectional, and there is no cyclic pathway included in the graph.](/cms/asset/c7372c1b-c497-4cda-8a44-fa0e8af2cf59/uaar_a_1585175_f0001_oc.jpg)
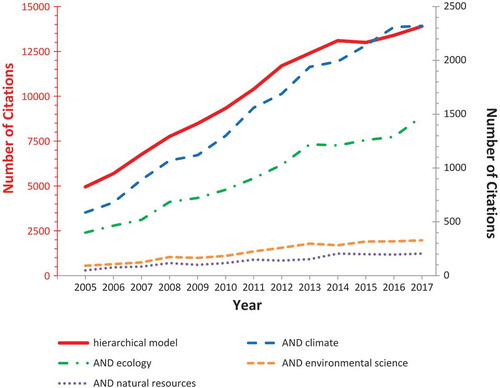
Figure 2. Publications listed by Google Scholar (https://scholar.google.com) over the past years (2005–2017). Search terms were “hierarchical model” either alone (plotted on the left y-axis) or together (logical AND) with the discipline (“ecology,” “climate,” “environmental science,” “natural resource”; all plotted on the right y-axis). The number of citations for hierarchical models almost tripled (a 2.8-fold increase) during the past 13 years, but that overall growth was exceeded by their applications in all fields: environmental science (3.6-fold increase), ecology (3.7-fold increase), climate (4.0-fold increase), and natural resources (4.2-fold increase).