Figures & data
Table 1. Location of the cores used in this study, and the average sediment accumulation rate (SAR) and the trend in the weight % of quartz over the last 5000 yrs.
Figure 1. Location map (see insert map for overall location). Dotted line shows the average April position 1870–1920 CE of the sea-ice edge (15 percent ice coverage). The lines labeled “Gray 1881” indicate the extent of sea ice as noted in his map (Gray Citation1881a). The full identifications for the cores are listed in . The names of the troughs in this part of the Iceland shelf are used in .
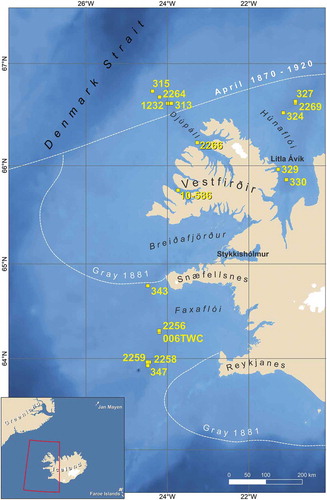
Figure 2. (A) Map showing the major surface currents around Iceland (red = warm, blue = cold), (B) temperature °C distribution at 50 m wd, and (C) salinity ‰ at 50 m wd for February 2013.
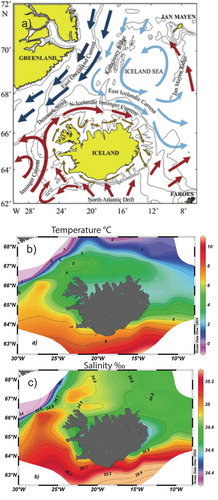
Figure 3. sediment diagram showing the limits of various proxies for drift ice (see text); namely, driftwood, quartz wt %, and the sea-ice biomarker IP25.
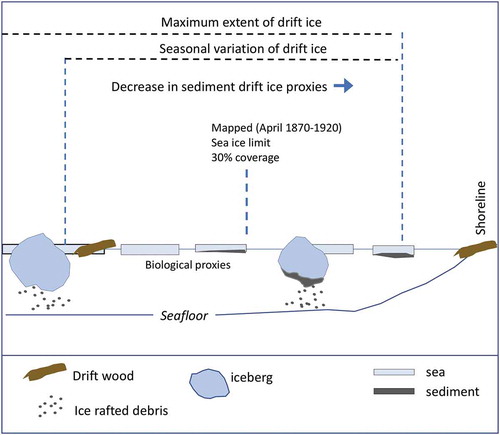
Figure 4. Plot of the surface (1997 CE) values for IP25 and quartz % (Cabedo-Sanz et al. Citation2016). The dashed black line shows the approximate limits of zero detection for both proxies.
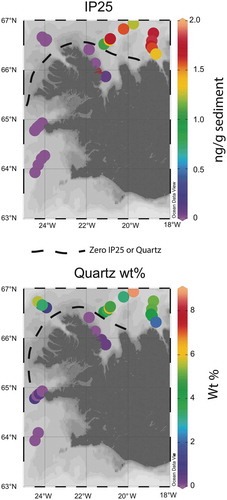
Figure 5. Comparison of measured quartz wt% estimates based on (1) mixture of non-clay and clay minerals and (2) ground samples of basalt. Note that the estimated quartz wt% on basalt samples equals 0 percent (cross symbol) and that quartz was always detected when it was present. The 45° line marks the 1:1 association between measured and estimated wt% (see Supplementary Material for additional data and results).
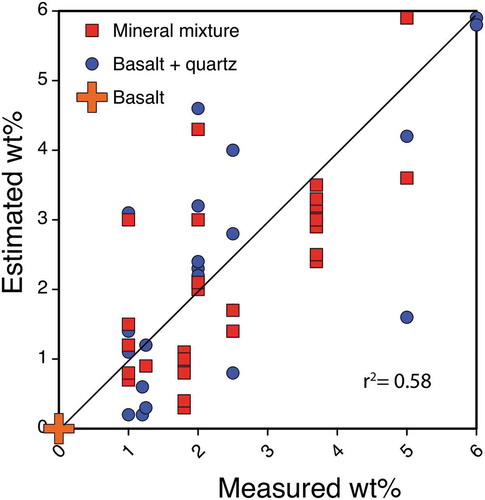
Figure 6. Map from Vilmundarson (Citation1969). Open circles show ice coming from the east in south Iceland (Hafís að austan) and from the west in northwest Iceland (Hafís að vestan). Sea ice off the north and east coast is not shown on this map; only the extremes. Other text on the map refers to individual Annals (annáll): Eyrarannáll before 1703 (um Þorra fram að sumri = from early year to next summer); Sauðlauksdalsannáll before 1778 CE; summary of Fitjaannáll before 1720 CE; Fitjaannáll before 1712 CE; Vallaannáll 1701 CE and later; Setbergsannáll 1715 CE. (The other text is 1 vika í maíbyrjun = one week in the beginning of May).
Figure 7. (A) Sea ice and icebergs off the coast of Iceland from 1983 to 2011. The data are from the Icelandic Meteorological Office (IMO), and are based on reports from ships, coastal stations, and ice reconnaissance flights from the Icelandic Coast Guard. The points are color coded by time intervals of observations. (B) Sea-ice indices in Marsden square areas #724 (blue) and #622 (orange), marked in the overview map. Note that the Marsden square numbers increase from right to left in increments of two. The indices are based on historical data, logbooks from ships, reports from weather stations, farmers’ diaries, letters, and newspapers. The temporal resolution is one month, so it is enough for the ice to be observed within the region for one day of the month to register. The graph shows five-year sums. There is a shift toward the data sources becoming more reliable with time, as observations became more systematic.
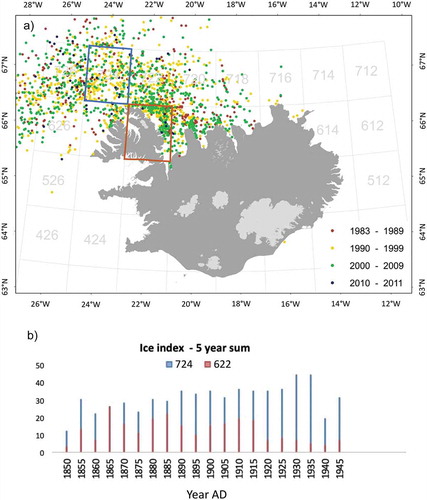
Figure 8. Data from (A) Húnaflói; (B) Djúpáll; (C) Breiðafjörður, Kolluáll; and (D) Faxaflói (see and for core locations). In all graphs quartz = red, calcite = blue, and they are plotted against calibrated years BP. Time scales for C.1 and C.2 are for the past 4,000 cal yr BP. Graphs A.1 and A.2 show the quartz and calcite data (Moros et al. Citation2006) and sea-ice biomarker data (Cabedo-Sanz et al. Citation2016) from MD99-2269. B.1 is the average and standard deviation estimates of quartz and k-feldspars in north–northwest Iceland cores (Andrews Citation2009). Graph D.1 shows the principal component scores and the vertical dashed lines outline the Holocene marine climate boundaries (Kristjánsdóttir et al. Citation2016).
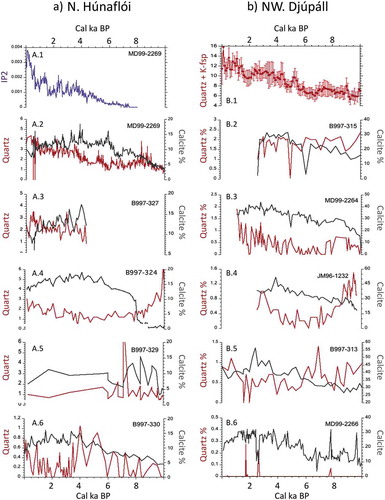
Figure 8. (Continued).
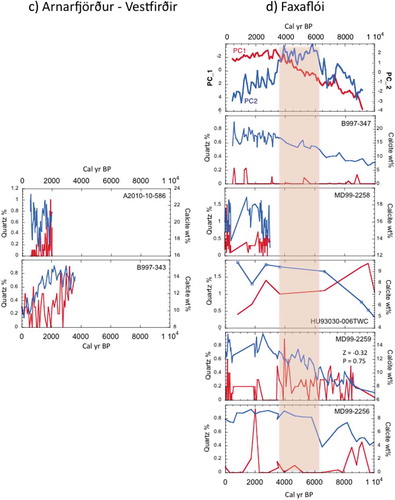
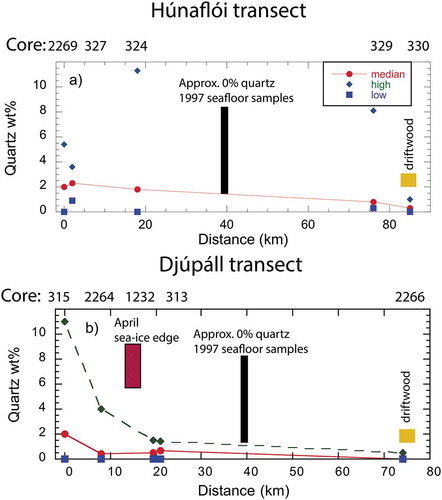
Figure 9. Transects of Holocene quartz wt% data for cores along the Húnaflóaáll-Húnaflói and Djúpáll-Ísafjarðardjúp troughs (), distance calculated from the outer cores. Note that the exact time period covered for each core varies (). The plots also include the minimum and maximum wt% and the median wt% for each core. Also shown is the occurrence of driftwood on beaches and the average April 1870–1920 sea-ice edge (see ).