Figures & data
Figure 1. Hypothesized framework for growing-season C fluxes: gross ecosystem photosynthesis depends on total aboveground biomass (Biomassabove), community-weighted mean of specific leaf area (SLACWM), and soil moisture (Hypothesis 1). Aboveground respiration (Rabove) depends on Biomassabove and SLACWM (Hypothesis 2a). Belowground respiration (Rbelow) depends on root biomass (Biomassroots), microbial activity, and SLACWM, where SLACWM in this context represents leaf decomposability (Hypothesis 2b). Microbial activity depends on vegetation woodiness, represented by the C:N ratio of aboveground vegetation (C:Nratio above), and on nutrient availability and leaf recalcitrance as represented by SLACWM (Hypothesis 3). Dashed lines between variables indicate important relationships not tested in this study. The framework is based on Wookey et al. (Citation2009); Clemmensen et al. (Citation2015); Veen, Sundqvist, and Wardle (Citation2015); Parker, Subke, and Wookey (Citation2015); and Becklin, Pallo, and Galen (Citation2012).
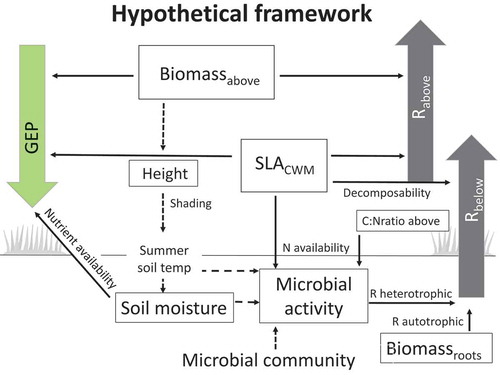
Table 1. Community means ± SD for alpine Empetrum-dominated heath, meadow, and Salix-shrub plant communities in Dovre Mountains, central Norway.
Table 2. Effects (µmol m–2 s–1) SD–1of each variable in full models across community. Explanatory variables were z-standardized (x – mean(x))/sd(x) so one unit change corresponds to one SD. Models were run without log transformation to ease understanding of the effects. Sum of squares (2) and p values were derived from a likelihood-ratio test (Chi-square test) performed on backward model selection (drop1 function in R; n = 17). Significant effects are bold.
Table 3. Gross ecosystem photosynthesis model selection based on AICc on multiple linear models, testing Hypothesis 1. GEP was standardized to 600 PAR (GEP600) and log-transformed. Soil moisture (%), specific leaf area (SLACWM; mm–2 mg–1), and aboveground biomass (Biomassabove; g DW m–2) were z-standardized. Akaike weight values (w) is the probability a model is best, given the set of models considered. R2 adjusted was calculated for each model (n = 17).
Figure 2. Full model variable relationships when plotting one variable and keeping the others constant. Relationships are across community and within community, based on growing-season measurements in alpine Empetrum-heath, meadow, and Salix-shrub plant communities in Dovre Mountains, central Norway (n = 17). Lines drawn are for significant variables across (red) and within community (black dashed line), tested with a likelihood-ratio test (Chi-square test) performed on backward model selection (drop1 function in R). Top (A–C): Gross ecosystem photosynthesis standardized to 600 PAR (GEP600; µmol m−2 s−1) and the variables community-weighted means of specific leaf area (SLACWM; mm−2 mg−1), total aboveground biomass (Biomasabove; g DW m–2), and soil moisture (%). Middle (D,E): Estimated aboveground respiration standardized to 20°C (Rabove; µmol m–2 s–1) and the variables SLACWM and Biomassabove (g DW m–2). Bottom (F–H): Estimated belowground respiration standardized to 10°C (Rbelow) and the variables SLACWM, root biomass (Biomassroots; g DW m–2), sum of all measured microbial activity (Microbessum; nmol h–1 m–2). Biomass roots and Microbessum was summed across the total soil pit with mean depth 56 ± 8 cm.
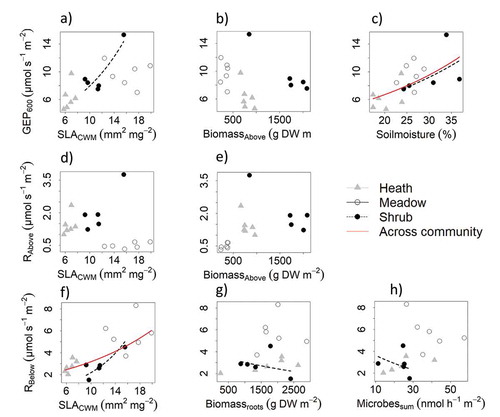
Table 4. Aboveground respiration (Rabove) model selection based on AICc on multiple linear models, testing Hypothesis 2a. Rabove was standardized to 20°C and log-transformed. Specific leaf area (SLACWM; mm–2 mg–1) and aboveground biomass (Biomassabove; g DW m–2) were z-standardized. Akaike weight values (w) is the probability a model is best, given the set of models considered. R2 adjusted were calculated for each model (n = 17).
Table 5. Belowground respiration (Rbelow) model selection based on AICc on multiple linear models, testing Hypothesis 2b. Rbelow was standardized to 10°C and log-transformed. Specific leaf area (SLACWM; mm–2 mg–1), the sum of microbial activity (Microbessum; nmol h–1 m–2), and standing root biomass (Biomassroots; g DW m–2) were z-standardized. Akaike weight values (w) is the probability a model is best, given the set of models considered. R2 adjusted were calculated for each model (n = 17).
Table 6. F value, degrees of freedom(df), and p value from one-way ANOVA tests of differences among enzyme activities (nmol h–1 m–2) between communities. The enzymes were from organic and mineral horizons, and total across the soil pit. The significant differences are bold. In the organic horizon b-gluc, cbh, xylo, and nag were significantly higher in the meadow than in the heath and shrub communities (p < 0.001, TukeyHSD). Activity of a-gluc in the meadow was only higher than the shrub community (p < 0.05, TukeyHSD).
Figure 3. Mean enzyme activity ±SD of α-glucosidase (a-gluc), β-glucosidase (b-gluc), cellobiohydrolase (cbh), β-xylosidase (xylo), and N-acetylglucosaminidase (nag), (A) in nmol h–1 m–2 and (B) in µmol h–1 gC–1 m–2 for alpine Empetrum-dominated heath, meadow, and Salix-shrub plant communities in Dovre Mountains, central Norway. Activity for each enzyme is the sum across the total soil pit with mean depth 56 ± 8 cm (n = 17). See activities in organic and mineral horizons in Figure S2, and statistical differences in and Table S2.
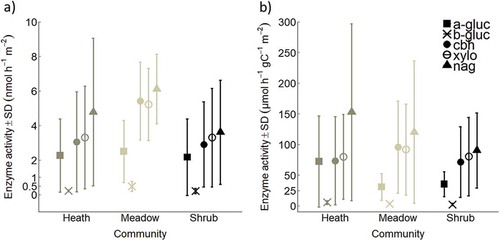
Figure 4. Total enzyme activity of β-glucosidase (b-gluc), cellobiohydrolase (cbh), β-xylosidase (xylo) (C enzyme activitysum) (nmol h–1 m–2) correlated with “vegetation woodiness” across alpine Empetrum-dominated heath, meadow, and Salix-shrub plant communities in Dovre Mountains, central Norway. Left, community-weighted mean of SLA (SLACWM; p = 0.009) and right, C:N ratio of aboveground vegetation (C:N ratioAbove-ground; n = 17).
Figure 5. Summary of results with respect to hypothesized mechanisms based on actual measurements of growing-season summer C fluxes GEP600) and ecosystem respiration partitioned into estimated aboveground (Rabove) and belowground respiration (Rbelow) in alpine Empetrum-heath, meadow, and Salix-shrub plant communities in Dovre Mountains, central Norway (n = 17). Up and down arrows indicate high or low values. Arrow style indicates a significant variable in the full model across community (red line), significant variable in simple correlation (red dashed line), significant variable within the community (black line), presumed relationship not tested in this study (black dashed line), nonsignificant variable across community (grey). The flux arrow width is proportional to its measured flux size transformed to gC m–2 h–1.
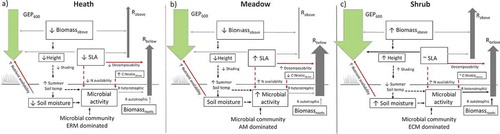
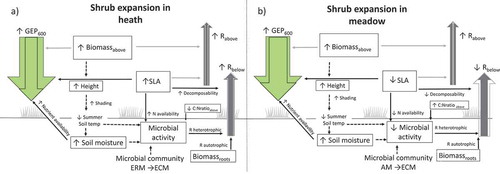
Figure 6. Summary of results with respect to suggested implications of shrub expansion based on actual measurements of growing-season summer C fluxes (GEP600 and ecosystem respiration partitioned into estimated aboveground (Rabove) and belowground respiration (Rbelow) in alpine Empetrum-heath, meadow, and Salix-shrub plant communities in Dovre Mountains, central Norway (n = 17). Up and down arrows indicate an increase or decrease in variables because of shrub expansion in the respective community. Arrow style indicates a significant variable within the community (black line), presumed relationship not tested in this study (black dashed line), nonsignificant variable across community (grey). The flux arrow width is proportional to its measured flux size transformed to gC m–2 h–1. The transparent arrows correspond to the flux in the community invaded by shrubs.