
Figures & data
Table 1. Translation of wording into numerical counts in days. X represents the number of days within the month.
Table 2. Number of months with snow occurrences on Haleakala during the forty-four-year period from 1915 to 1958. Our raw count represents the total number of snow days, while the adjusted count excludes reports of snow that were not from a nearby station.
Table 3. Number of months with snow occurrences on Maunaloa during a forty-four-year period (1915–1958). Our raw count represents the total number of snow days, while the adjusted count adds sole reports of snow on Maunakea.
Figure 1. Number of days with snow cover per year on Maunakea from 1893 to 1972. The solid black line represents the best estimate and the shaded region stretches from the minimum estimate to the high estimate.
Table 4. Best estimate monthly average number of days with snow cover on Maunakea for the entire study period 1893–1953 and for the half century 1901–1950.
Figure 2. Best estimate number of snow-cover days for winter (November–April) and summer (May–October) from 1893 to 1953, and the best-estimate number of snow-cover days per winter from 2000–2001 to 2014–2015.
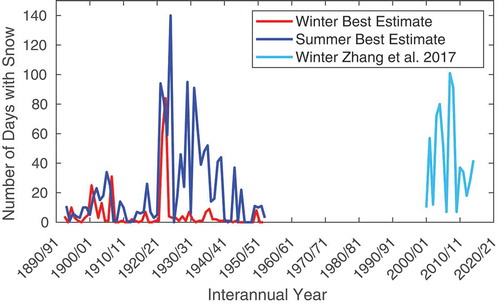
Figure 3. Maximum albedo of snow cover as a function of snow age following three major snowfall events on Maunakea. The date for the first day of each time series is given in the legend.
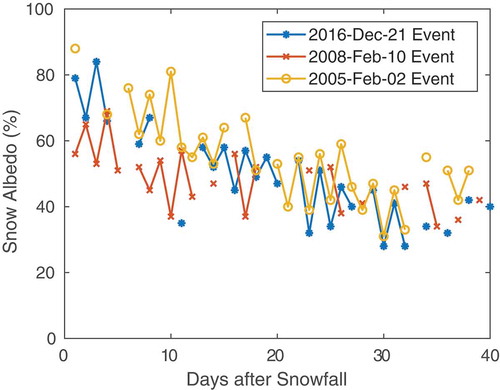
Figure 4. Snow cover and ground temperature at 1 m depth during three years. Following the winter without significant snow, the ground warmed faster and reached a higher temperature than in years with significant snow cover.
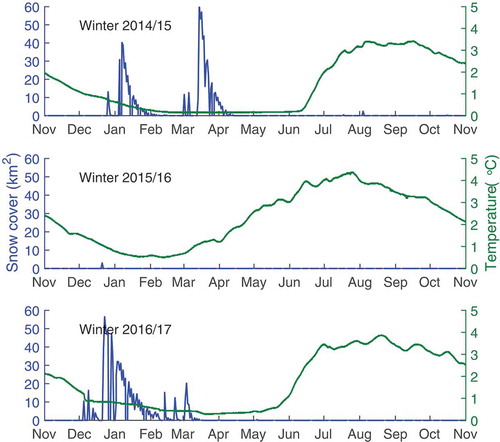
Table 5. Ground and air temperature on Maunakea after winters with and without snow cover. Snow days are based on MODIS satellite observations. Ground temperature is based on hourly in situ measurements near a permafrost body, and air temperature is based on CFHT weather tower data. The temperature of the ground was higher following the winter without significant snow, although air temperature was not.