Figures & data
Figure 1. (a, b) Photographs of Llullaillaco penitente field at 5,277 m a.s.l., Jack Darcy and Lara Vimercati are pictured for scale in (b). (c, d) Closeup pictures of red patches in penitente ice close to the tephra ground. and have been modified with Adobe Photoshop CS5 to enhance the color of the red patch. Input levels of the image were adjusted using the quick selection tool to select the area of interest (red ice) and selective color percentages were adjusted by increasing magenta and yellow to make the red ice stand out. Photos by G. Zimmerman and S. K. Schmidt.
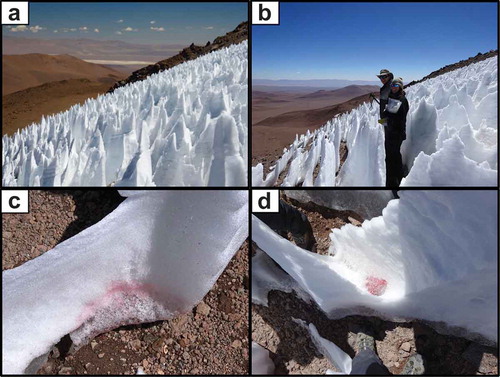
Figure 2. Alpha rarefaction curves based on the number of operational taxonomic units (OTUs) observed for penitente ice and soils within and below penitentes based on a 97 percent similarity clustering: (a) eukaryotes and (b) bacteria. Soil within and below penitentes had two times the number of eukaryotic OTUs and about four times the number of bacterial OTUs compared to the penitente ice (18S ANOVA p < .001, F = 63; 16S ANOVA p < .001, F = 66.24). Data shown are means ± s.e. (soil within penitentes n = 5; soil below penitentes n = 4; red ice n = 5; clear ice n = 2). Note that the scale of the y-axis changes between the panels.
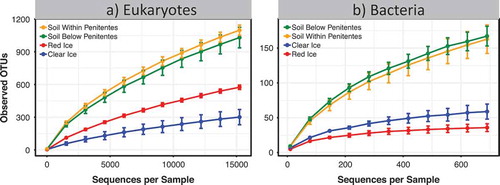
Figure 3. Cluster diagram-based PCoA plot using weighted Unifrac of eukaryotes (a) and bacteria (b). Both eukaryotic and bacterial soil communities and ice communities are significantly different from each other (18S ADONIS p < .001, R2 = 0.63; 16S ADONIS p < .001, R2 = 0.46). Polygons surround total soil and total ice communities in both figures.
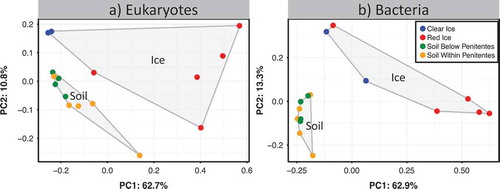
Table 1. Sequences count, GenBank ID of the closest blast hit, identity percent, and tentative taxonomic affiliation of most abundant phylotypes retrieved in red and clear penitentes ice samples: top= eukaryotes; bottom = bacteria.
Figure 4. Relative abundance of the main eukaryotic phylotypes as a percentage of total sequences retrieved from penitente ice and soil samples based on polymerase chain reaction (PCR) amplifications of the 18S rRNA gene using Euk1391F/EukBr primer sets. Snow algae make up most of the diversity in red ice samples and they are abundant in soil samples within and just downhill from the penitente field.
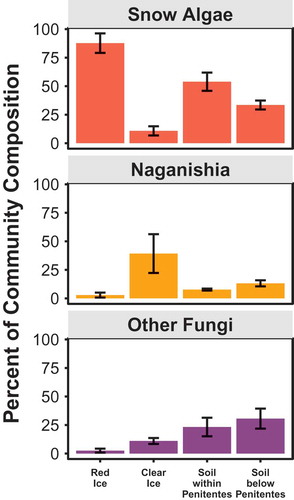
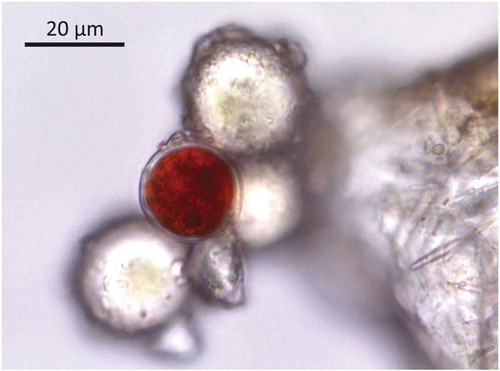
Figure 5. Photomicrograph (1000x magnification) of a spore of a Chlamydomonas sp. from red penitente ice.