Figures & data
Figure 1. Schematic of study design across the elevational range of alpine habitat in the White Mountains, CA, USA. Sites (white diamonds) are numbered in ascending order from low to high elevation. In each of the sites, 30 × 30 cm plots were randomly assigned to one of four treatments (ambient, heated, watered, heated and watered) with a replication of two plots per experimental treatment (and a replication of four plots for the ambient treatment in all sites, except site 2 and site 3, which also had a replication of two plots for the ambient treatment). The heating treatment was performed using passive warming chambers (shown in the top right in sites 9, 5, and 1). Species abundance was quantified in each plot in 2015, 2016, and 2017 as the frequency of presence in each cell (gridded cells shown in the bottom right).
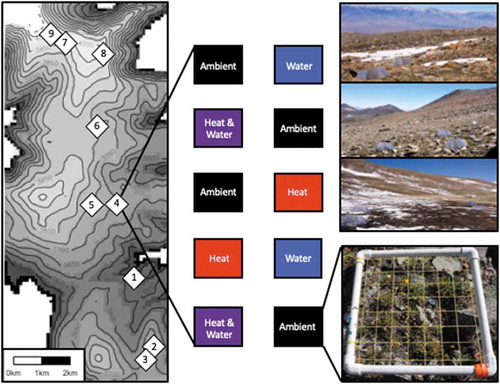
Figure 2. Map of climatic water deficit (CWD; mm) for California with points representing the locality data for all study species used to calculate the species climatic niche means. In subset, the relationship between the proportional frequency averaged across all sites for each species and the species climatic niche mean.
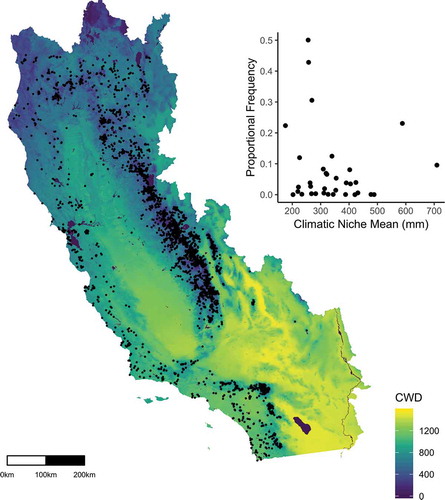
Table 1. Study species with the number of sites that the species were present in, mean frequency within a plot for sites in which the species were present, and species-specific climatic niche means (CNM) based on the species regional distribution.
Figure 3. Mean ambient community-weighted climatic niche (CCN) across plots in relation to the (a) elevational and (b–d) climatic gradients. Note that climate values were averaged across the ambient plots, so they are shared by all plots within a site. Lines represent significant model fits.
Figure 4. (a) Species richness deceased with experimental heating and watering. (b) The CCN seventy-fifth percentile significantly increased with the experimental heating. Letters indicate significantly different groups. (c) Mean CCN responses to climate manipulations show a non-significant trend of higher mean CCN with heating, and a lessening of this effect when heating is in combination with experimental watering. There are no significant differences between any of the treatment groups. (d) The CCN twenty-fifth percentile had no significant response to the treatments.
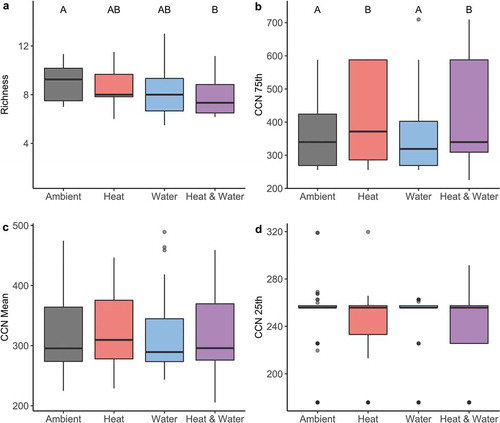
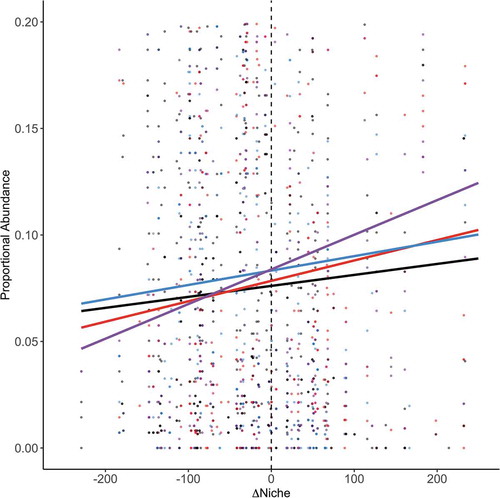
Figure 5. The proportional abundance of species relative to the difference between the species climatic niche mean and the aggregated ambient site CCN mean (∆niche). Each point represents a species by site by year combination. The lines represent model fits for each treatment group: ambient (black), heating (red), watering (blue), heating and watering (purple).