Figures & data
Figure 1. Study-area location. The ecological subsections analyzed for water surface area are displayed, with their lake and pond surface area in percent. The excluded areas are subsections that had less than 1 percent lake and pond surface area. National Park Service unit abbreviations are: Bering Land Bridge National Preserve (BELA), Cape Krusenstern National Monument (CAKR), Gates of the Arctic National Park and Preserve (GAAR), Kobuk Valley National Park (KOVA), and the Noatak National Preserve (NOAT).
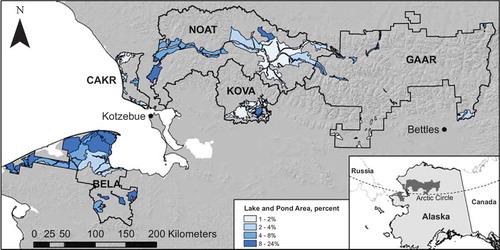
Figure 2. Mean annual air temperature for Kotzebue, Alaska, 1980–2018. National Weather Service data from NOAA Regional Climate Centers (Citation2018). Points for years mentioned in the text are labeled. Means were computed for water years (October–September).
Figure 3. Annual precipitation and estimated annual potential evapotranspiration at Kotzebue (top) and Bettles (below). Precipitation and temperature data were obtained from NOAA Regional Climate Centers (Citation2018). Evapotranspiration was estimated by the Hargreaves-Samani method, which is the most accurate at high latitudes of the simple temperature-based methods (Hargreaves and Allen Citation2003; Almorox, Quej, and Pau Citation2015).
Figure 4. Examples of generalized lake landscapes: ice-rich thaw lake plain (left), ice-rich deep silt (center), and glacial deposits with low to moderate ice content (right). The former two landscapes have lakes of mainly thermokarst origin and outlines of drained former lakes are visible on the images.
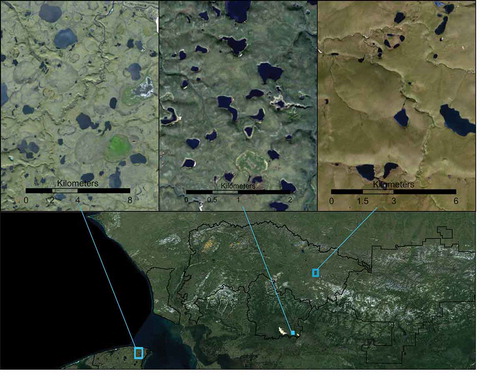
Figure 5. Histograms of Landsat SWIR reflectance (times 103) of random points in water bodies and on land in Landsat ARD tiles h02v04 and h04v03 for years 1984–2017.
Figure 6. (a) Water surface area versus year for the Noatak Glaciated Lowlands subsection (NOAT). This subsection showed a strong minimum at approximately 2010, with no significant long-term change. (b) Water surface area versus year for the Bering Straits Lower Coastal Plain subsection (BELA). This subsection showed a significant long-term decline, with a minor minimum at approximately 2008–2010. The estimated 2018 value was determined by subtracting from the 2017 value the area of lakes that drained abruptly in 2018. (c) Water surface area versus year for the Nigu River Valley (GAAR). This subsection showed an increase in water surface area from 2000 to 2017. Note the different scales of the three figures: the range of variation in (b) is large, more than 1 percent, compared to 0.3 percent and 0.25 percent in (a) and (b).
Table 1. Lake area change 2000–2017 by ecological subsectiona.
Figure 7. (a) Lake-area change in the western part of the study area (BELA), (b) the central part (CAKR, KOVA, and NOAT), and (c) the eastern part (GAAR). Subsection colors give the overall trend in water area 2000–2017: red for decreasing and blue for increasing, with bright colors indicating significance at p < .05. Circles mark the location of lakes that drained, with circle size proportional to the area lost and shading keyed to the decade of drainage: white (1985–2000), gray (2001–2010), and black (2011–2017). Drained lakes are defined as those that had half or less as much surface area in 2017 as 2000. The year they first lost 25 percent or more of their area was identified as the year of drainage.
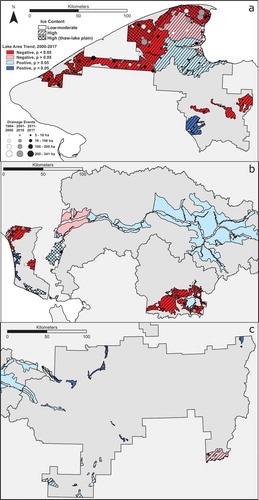
Figure 8. (a) Loss of water area by year of the 108 lakes that were identified as “drained” during 2000–2017. These were lakes that had half or less as much surface area in 2017 as 2000, and had a maximum surface area of 5 ha or more. (b) Count of new lake-drainage events by year, 2000–2017. The final values (2018) on both plots were estimated from partial coverage of the study area in September 2018.
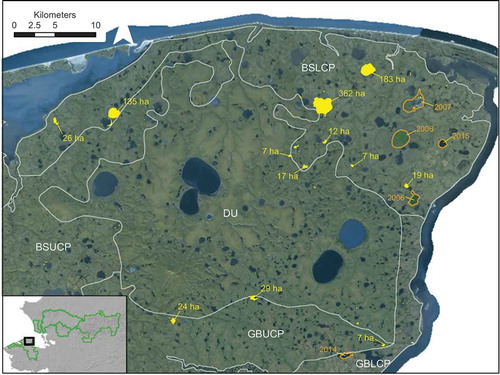
Figure 9. Lake loss in northeastern BELA. Areas that lost water between 2017 and 2018 are shaded in yellow, and those more than 5 ha in area are labeled in yellow with area lost, in hectares. Pre-2017 lake losses are outlined and labeled with the year in orange. The white lines outline ecological subsections (Jorgenson Citation2001) used as analysis areas: BSLCP, Bering Straits Lower Coastal Plain; BSUCP, Bering Straits Upper Coastal Plain; DU, Devil Uplands; GBLCP, Goodhope Bay Lower Coastal Plain; GBUCP, Goodhope Bay Upper Coastal Plain. The background image is from 2010 (Alaska Geospatial Council Citation2011).