Figures & data
Figure 1. Snow pit sites at the East GRIP (EGRIP) camp in Greenland and the 2014–2015 eruption site in Iceland.
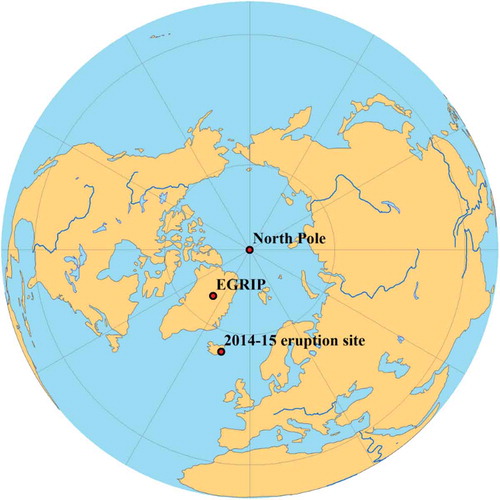
Figure 2. Vertical profiles of stable water isotopes and D-excess. Black and red lines represent winter and summer layers, respectively; the data were obtained from Du et al. (Citation2019c).
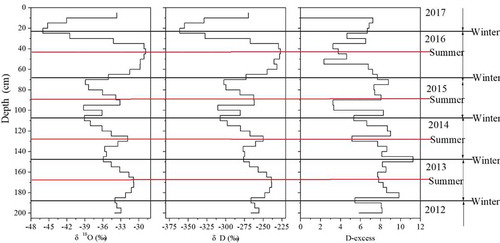
Figure 3. Vertical profiles of δ18O, micro-particle, mass, dissolved Fe, and total dissolved Fe concentrations (black and red lines represent winter and summer layers, respectively). The δ18O, micro-particle, and mass data were obtained from Du et al. (Citation2019c).
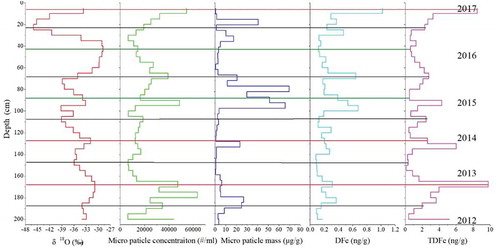
Figure 4. The δ18O and micro particle concentrations (Du et al. Citation2019c). as well as total dissolved REEs (total dissolved light REE: TDLREE, total dissolved medium REE: TDMREE, total dissolved heavy REE: TDHREE), in the East GRIP snow pit (black and blue lines represent winter and summer layers, respectively).
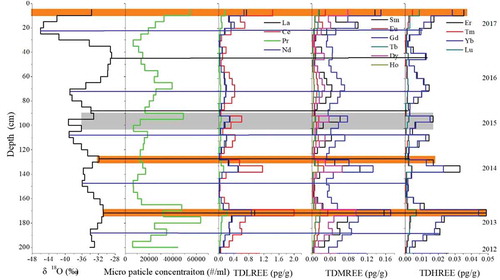
Figure 5. The concentrations of the TDREEs between the East GRIP snow pit (left) and the aerosol samples (Ilyinskaya et al. Citation2017, right) during the Holuhraun eruption.
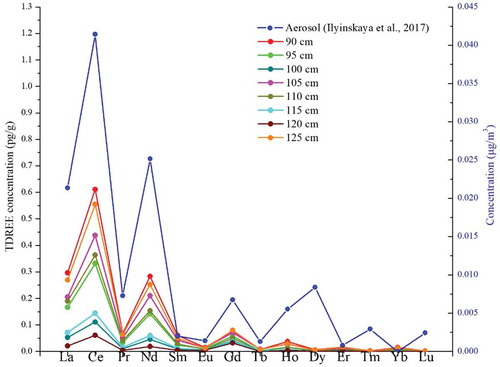
Figure 6. Five-day backward trajectories of air masses arriving at the East GRIP site during the 2014–2015 eruption period (31 August 2014 to 27 February 2015).
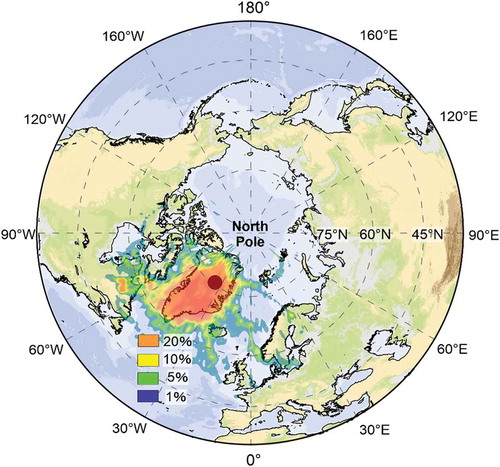
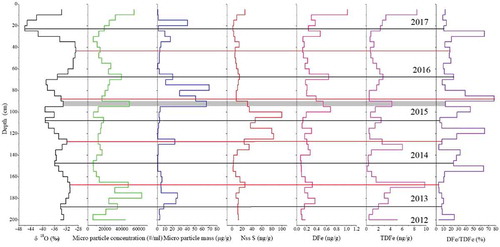
Figure 7. Vertical profiles of δ18O, micro-particle concentration, micro-particle mass, total dissolved non-sea salt S (Nss S), dissolved Fe (DFe), and total dissolved Fe (TDFe) concentrations and Fe fraction solubility (DFe/TDFe) (black and red lines represent winter and summer layers, respectively).