Figures & data
Figure 1. Location of tidewater glaciers on Prince of Wales Icefield with >1 km terminus width, and distribution of their cumulative plume events from 1997 to 2015. Inset: Ellesmere Island. Base image: USGS/NASA Landsat 8, July–September 2015.
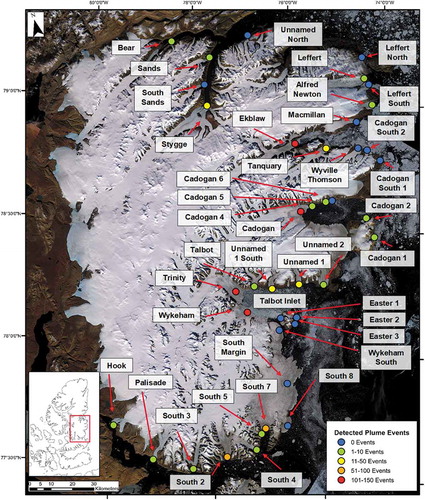
Table 1. Type and number of satellite images analyzed for each year in this study.
Figure 2. Examples of iceberg plume classification for Radarsat-2 ScanSAR Wide beam mode imagery (100 m resolution): (a) size 1 (<1 km2); (b) size 2 (1–10 km2); (c) size 3 (10–20 km2); and (d) size 4 (20–30 km2). Dotted line shows the approximate terminus outline for Trinity and Wykeham glaciers. Data and Products © MacDONALD, DETTWILER AND ASSOCIATES LTD (2015) – All Rights Reserved. RADARSAT is an official mark of the Canadian Space Agency.
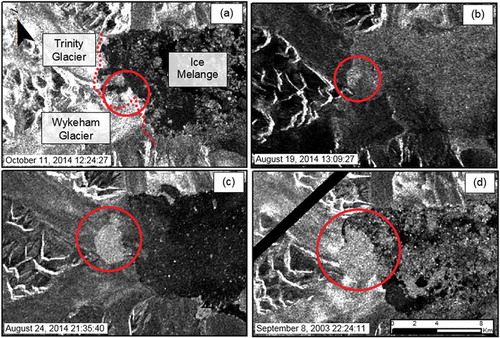
Figure 3. (a) Total yearly plume events produced by Trinity and Wykeham glaciers (dark grey) compared to plume events from all other major glaciers in the study (light grey). Figures above columns represent the proportion (%) of total iceberg plumes produced by Trinity and Wykeham glaciers. (b) Normalized yearly plume events (number of plume events per number of available satellite scenes) produced by all glaciers in the study.
Table 2. Total yearly detected plume events produced by all glaciers in the study between 1997 and 2015. The values show the total number of events per size category per glacier for each year (i.e. 0,0,0,0,= size 1 events, size 2 events, size 3 events, size 4 events).
Table 3. Distribution of total plume events for all glaciers in the study from 1997–2015 based on sea ice conditions.
Table 4. Number of plume events per week for the four most active glaciers in the study based on sea ice conditions.
Figure 4. Temporal variability of iceberg plumes produced by (a) Trinity Glacier, (b) Wykeham Glacier, (c) Cadogan Glacier, and (d) Ekblaw Glacier between 1997 and 2015. Grey area represents the presence of landfast sea ice and white area represents absence of landfast sea ice.
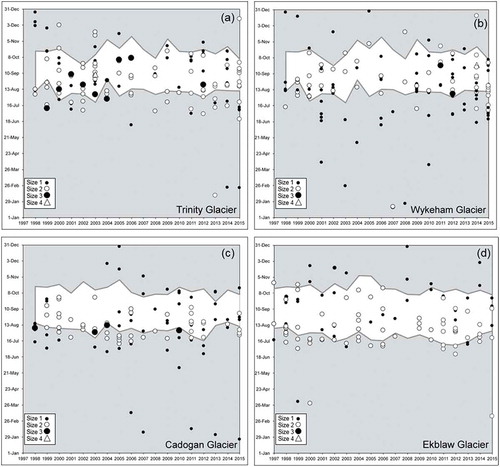
Figure 5. Terminus outlines 1998–2015 for Trinity, Wykeham, Talbot, Unnamed 1 South, Unnamed 1, and Unnamed 2 glaciers in Talbot Inlet. Base image: USGS/NASA Landsat August 29, 2014.
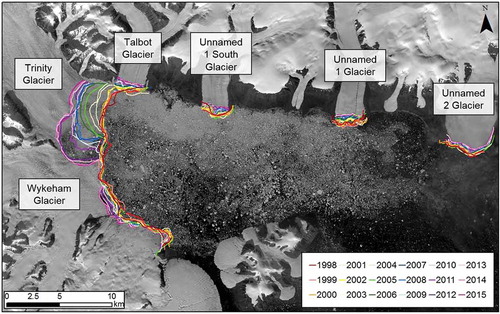
Table 5. Comparison between plume events from 2011–2015, average ice flux from 2011–2015 (Van Wychen et al. Citation2016) and change in glacier length from 2009–2015 (Cook et al. Citation2019). Weighted Total and Type refers to categories and scale described in Section 5.1. Data is only shown for glaciers where ice flux and change in glacier area data was available.
Figure 6. Temporal trends from World Ocean Database (WOD13) data (up to 100 km offshore). Mean oceanic temperatures from 1972–2010 for 77–79°N (POW Icefield) for 50–500m depths. Error bars are ±1 SE.
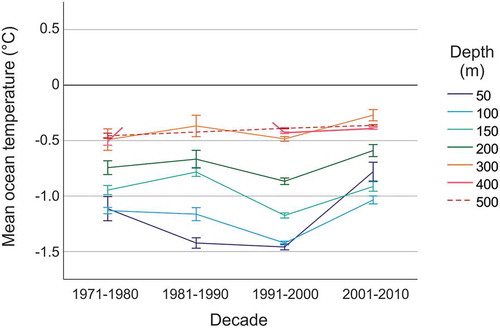
Figure 7. Mean monthly air temperatures for POW Icefield from July to October for 1997–2015 produced from NCEP-NCAR Reanalysis data (1981–2010 climatology). Source: Kalnay et al. (Citation1996).