
Figures & data
Figure 1. Glacier National Park is located in northwestern Montana, U.S., and is bordered by Canada to the north. Little Ice Age glaciers (Fagre and Martin-Mikle 2018), including two southwest of the park in the Flathead National Forest, are shown in red and are located in the higher elevations (black) of the park in the Lewis and Livingston mountain ranges. Elevation data source: National Elevation Dataset, 2002; U.S. Geological Survey web site.
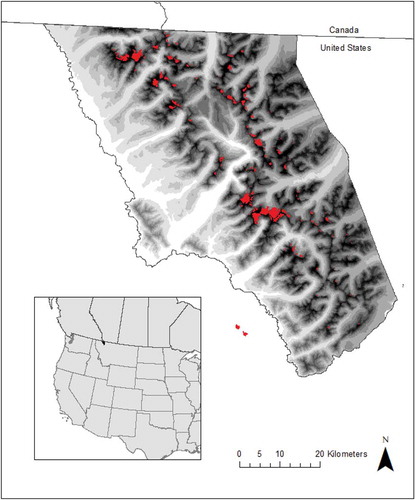
Figure 2. Swiftcurrent Glacier, 27 August 2005, National Agricultural Imagery Program. Swiftcurrent Glacier in Glacier National Park is an example of the cirque glaciers that are characteristic of the glaciers present in the park today. The Little Ice Age extent of Swiftcurrent Glacier is denoted by the red line.
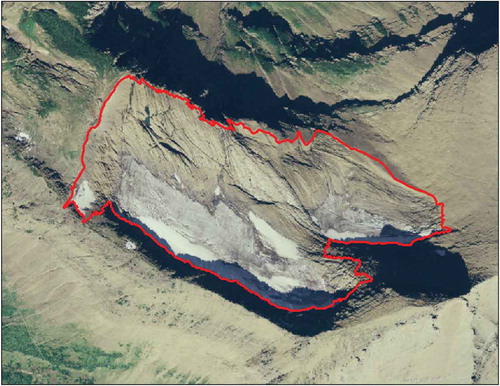
Table 1. Imagery-based data sources used to derive LIA glacier area data.
Figure 3. Estimated areas and volumes for 146 Little Ice Age glaciers based on four sets of constants developed by Chen and Ohmura (Citation1990) used in area-volume scaling. Fountain and Basagic (Citation2011) and Fountain, Glenn, and Basagic (Citation2017) found “Cascade, small glaciers” to best fit the western United States and, as such, we employ this set of constants as well. Granshaw and Fountain (Citation2006) estimate that uncertainty can be as much as ±50 percent for individual glaciers, but when calculating total volume on a regional scale, can be smaller as a result of errors offsetting one another. Following Fountain and Basagic (Citation2011), these volumes should be regarded as approximate.
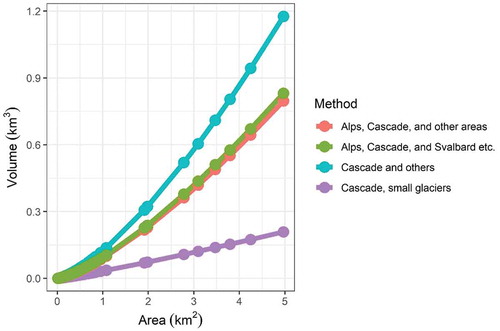
Table 2. Little Ice Age to 2005 number, area, and volume estimates of glaciers in GNP, including two in the adjacent Flathead National Forest. In the data presented here, all glacier areas are >0.01 km2.
Figure 4. Percent of LIA glacier area decrease (black) from the LIA to 2005.
Figure 5. Distribution, Little Ice Age (LIA) relative sizes, and percent area decrease from the LIA to 2005 of all glaciers in Glacier National Park (and two southwest of the park in the Flathead National Forest). LIA glaciers with high percent area decrease are shown in yellow, and those with low percent area decrease are shown in dark blue.
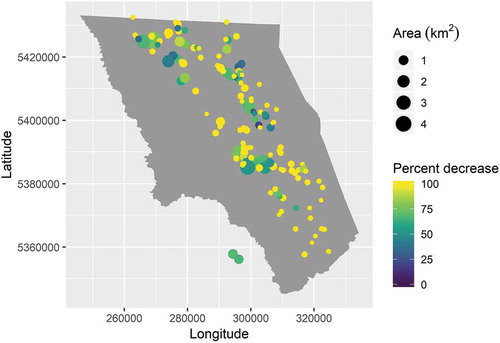
Figure 6. The relationship between GNP LIA glacier area and percent decrease from the LIA to 2005 demonstrates that variability in percent decrease exhibited by small glaciers is large, whereas all larger glaciers (>1.91 km2) have lost between 42.98 percent and 79.97 percent.
Table 3. Little Ice Age, 2005 and 2015 number, area, and volume estimates for subset of thirty-nine glaciers in GNP, including two in the adjacent Flathead National Forest. In the data presented here, all glacier areas are >0.01 km2.
Table 4. Little Ice Age and 2005 glacier areas (m2) and corresponding percent decrease of glacier area for a subset of thirty-nine glaciers in Glacier National Park and in the adjacent Flathead National Forest.