Figures & data
Figure 1. Location map (a) and satellite image (b) of the Grigoriev Ice Cap in Kyrgyz Republic, central Asia. The location map is from a global map provided by NASA earth observatory. The satellite image was acquired on August 25, 2001, by Landsat 7 Enhanced Thematic Mapper Plus. Photographs of the dominant vegetation near the glacier include alpine grassland (c) and coniferous forest (d). Images: (a) and (b): NASA; (c) and (d): author Nozomu Takeuchi.
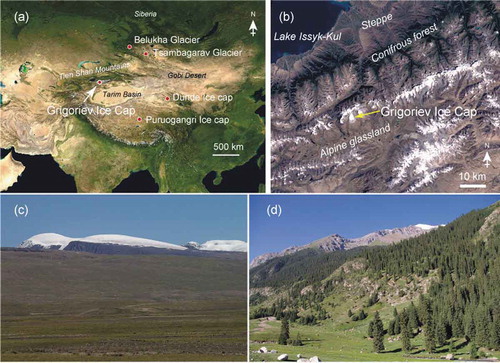
Figure 2. Photograph of five major pollen grains of the Grigoriev ice core observed with a fluorescence microscope: (a) Picea; (b) Artemisia; (c) Chenopodiaceae; (d) Ephedra; and (e) Pinus. Scale bars are 50 µm for (a) and (b) and 20 µm for (c), (d), and (e).
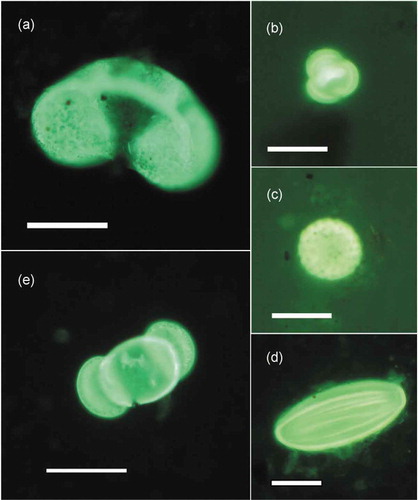
Figure 3. Vertical profiles of total concentrations and five pollen-type concentrations: (a) total; (b) Picea; (c) Artemisia; (d) Chenopodiaceae; (e) Ephedra; (f) Pinus; and (g) oxygen stable isotope from the surface to bedrock (87 m depth) of the Grigoriev ice core. Total includes the five major types and other unidentified pollen types counted in this study.
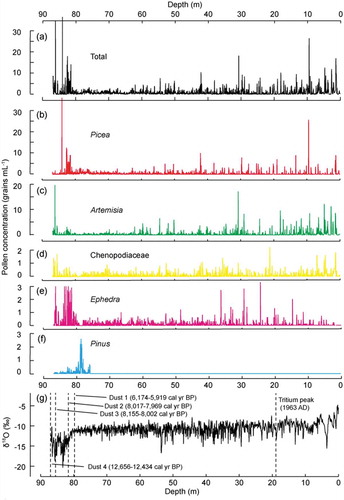
Figure 4. Vertical profiles of (a) total, (b) Picea, and (c) Artemisia-type pollen concentrations, and (d) the oxygen stable isotope in the upper 70 m of the Grigoriev ice core. Dashed horizontal lines mark annual boundaries determined by each pollen type, and full horizontal lines show the boundaries identified every ten years. Total includes the five major types and other unidentified pollen types counted in this study.
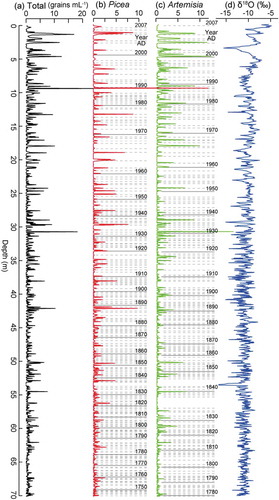
Figure 5. Detailed vertical profiles of Picea- and Artemisia-type pollen concentrations, and oxygen stable isotopes from 15 to 25 m (a) and from 55 to 65 m (b) of the Grigoriev ice core. Dashed horizontal lines mark annual boundaries and full horizontal lines show the boundaries identified every ten years.
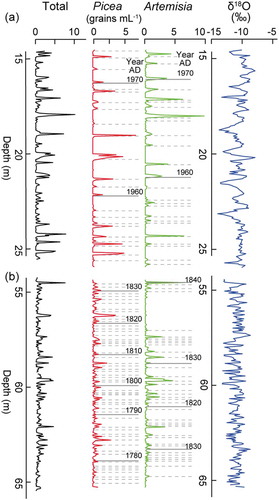
Figure 6. Depth and year (AD) relationships of the Grigoriev ice core determined by two pollen signals and by an ice thinning model with the assumption of different annual accumulations (250, 300, and 350 mm w.e. year−1).
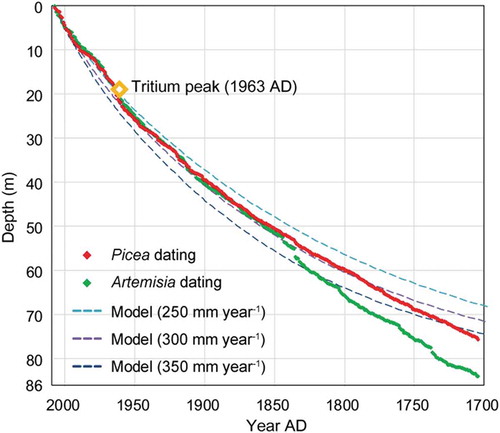
Figure 7. Inter-annual variations for the last 120 years in stable isotopes on the basis of pollen annual layer counting (a) and instrumental air temperature at Almaty (b) and a correlation plot between them (c).
Figure 8. Inter-annual variations for the last 220 years in oxygen stable isotopes (a) and net accumulation (b) of the Grigoriev ice core based on pollen annual counting. The thin and thick lines indicate annual and five-year running mean, respectively.
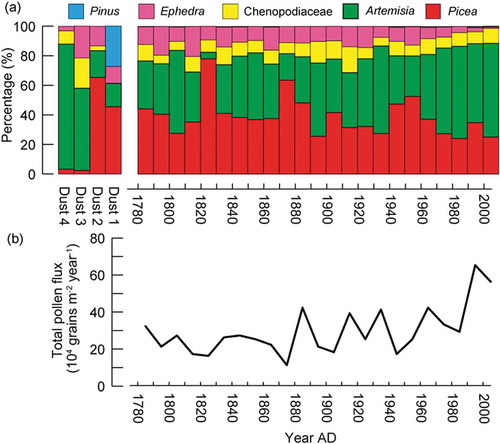
Figure 9. Decadal pollen assemblages (a) and total pollen flux (b) in the Grigoriev ice core. Pollen assemblages in the ice at the four dust layers near the bottom are also shown (a). The dust layer numbers correspond to those in . Total pollen flux includes the five major types and other unidentified pollen types counted in this study.