Figures & data
Figure 1. Map of the locations of the two glacierized summits in central Mexico: Pico de Orizaba (top right) and Iztaccíhuatl (lower left).
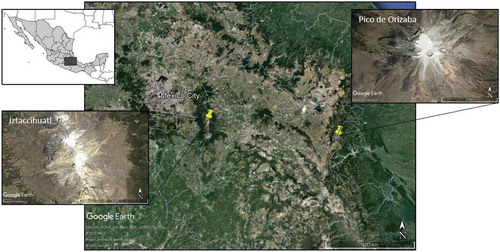
Figure 2. Boundaries of Glaciar Norte (Pico de Orizaba) derived from mostly snow-free images since 2001 using Landsat 7 (ETM+), Landsat 8 (OLI), and Sentinel-2 (MSI). Outlines are overlain on a false-color composite of the Landsat 8 image from March 2019. Note that there is a slight shift in the georeferencing between Landsat and Sentinel-2, so the 2018 outline is somewhat offset. White boxes highlight the regions of greatest change since 2001.
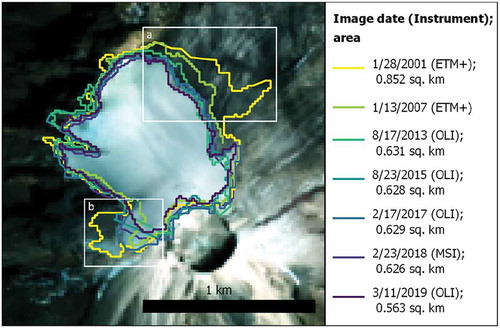
Figure 3. Changes in Glaciar Oriental on Pico de Orizaba between 2001 and 2018, compared to the outline in the RGI from 2009. Most outlines are derived from images from ETM+ on Landsat 7 with the exception of 23 February 2018, from MSI on Sentinel-2. The background image is a color composite of the image from February 2018.
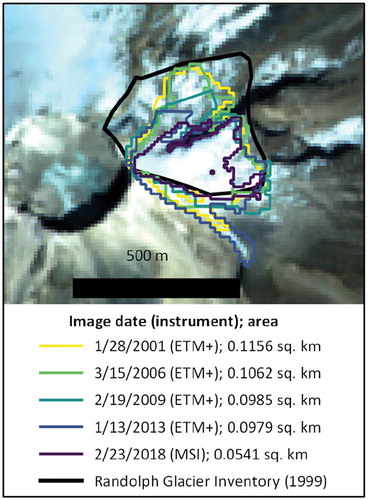
Figure 4. Glacier outlines at the summit of Iztaccíhuatl derived from Landsat images collected between 2003 and 2018 and a Sentinel-2 image from 2017. White boxes highlight some of the observed areas of retreat. Outlines are overlain on the OLI image from January 2018. *Two different ETM+ images from 14 November and 30 November 2005 are included to obtain an improved outline across data gaps. However, we do not use this merged outline to obtain the areal extent at this time point.
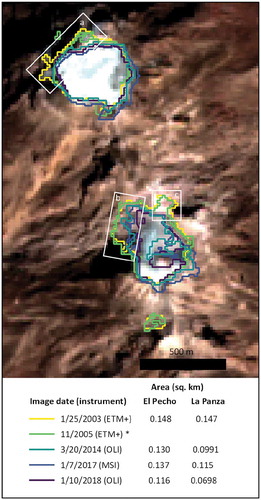
Figure 5. Land surface temperature maps (for temperatures less than 4°C) at Pico de Orizaba, derived from a selection of Landsat images (a)–(f) during the dry season in January and (g)–(l) during the wet season (April–October) on Pico de Orizaba. Glacier outlines shown are from , where the outline from the temporally closest snow-free image was used for each time point: (a) 28 January 2001; (b) 7 January 2005; (c), (d), (g), (h) 19 February 2009; (e), (i) 17 August 2013; (j) 18 December 2014; (f), (l) 11 January 2018; and (k) 29 November 2016. At all January time points shown, the ice temperatures are colder than −8°C. In many cases, the surface temperatures adjacent to the glacier are also below freezing. Many of the wet season images contain extensive snow cover, with the exception of (g) and (l).
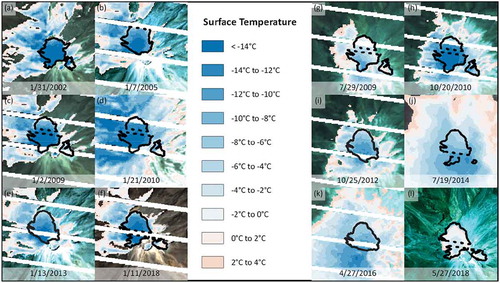
Figure 6. (Top) Monthly average surface temperatures across Pico de Orizaba’s Glaciar Norte and the (bottom) associated elevation profile. Regions shaded in gray are adjacent to the glacier (using the boundaries mapped in 2018). Inset map shows the location of the profile (superposed on a 2018 OLI image), and the dashed cyan line demarcates the freezing point of water. The standard error for each profile is within a few degrees (see Supplemental Figure 1 for error bands).
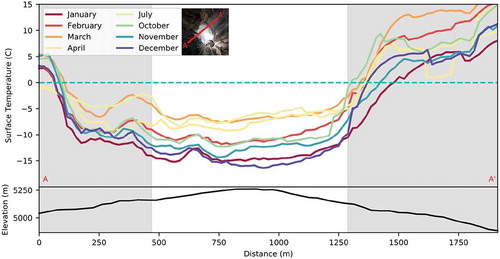
Figure 7. (Top) Monthly average surface temperature profiles of Glaciar Norte on Pico de Orizaba, along a profile that extends northwest from the summit crater, with the (bottom) associated elevation profile. The gray-shaded region is the soil beyond the edge of the glacier, and the dashed horizontal cyan line represents the freezing temperature of water. The standard error for each profile is generally plus or minus a few degrees (see Supplemental Figure 2 for error bands).
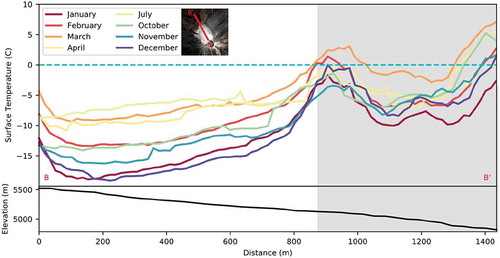
Figure 8. Average monthly surface temperature profiles across Glaciar Oriental on Pico de Orizaba, spanning the outline from the RGI (black outline in inset). Gray-shaded regions do not contain glaciers (each boundary is labeled with the year at which the glacier ended at that point along the profile). The dashed vertical gray line represents the ridge that bisects the region, where the glacier is presently limited in extent to south of the ridge. The bottom plot shows the elevation along the profile from the ASTER GDEM2 (see Supplemental Figure 3 for error bands).
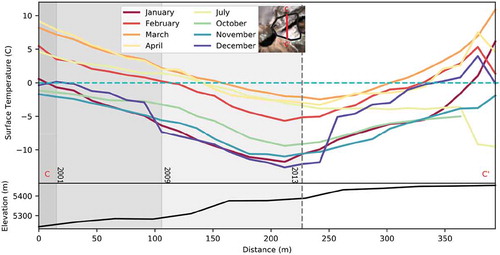
Figure 9. Surface temperature profiles, averaged by month since 2002, spanning the two remaining glaciers on Iztaccíhuatl. Gray-shaded regions do not contain glaciers, whereas the regions with white backgrounds cover (from left to right) La Panza and El Pecho. The bottom plot shows the variation in elevation along the track from the ASTER GDEM2 (for error bands, see Supplemental Figure 4).
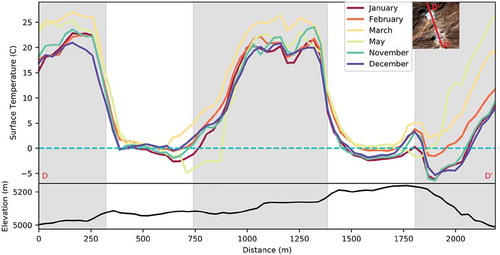
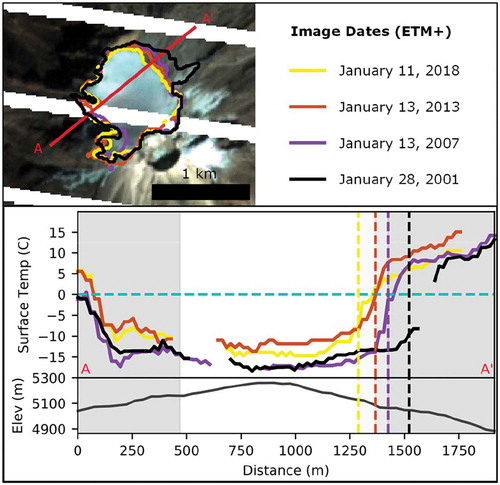
Figure 10. (Top) Retreat of Glaciar Norte at Pico de Orizaba and (bottom) associated surface temperature and elevation profiles from A to A′. Glacier outlines were obtained from ETM+ images collected around the same time of year (dashed parts of the outlines reflect gaps in image coverage) and are overlain on a false-color composite from January 2018. The dashed horizontal cyan line in the temperature profile plot highlights the freezing point of water, and the vertical dashed lines show the retreat of the glacier edge at each time point. All yellow lines correspond to 2018; all orange lines correspond to 2013; all purple lines correspond to 2007; and all black lines correspond to 2001. The bottom part of the profile plot shows the elevation along the profile.