Figures & data
Figure 1. Six World Wildlife Fund (WWF) Ecoregions and 3,000-m contours on the Tibetan Plateau.
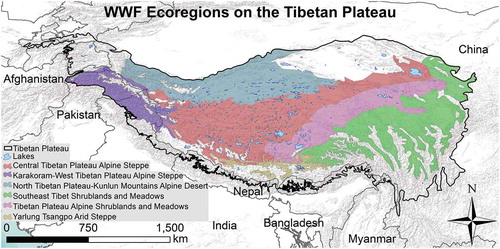
Figure 2. Sixty-nine terrestrial protected areas on the Tibetan Plateau.
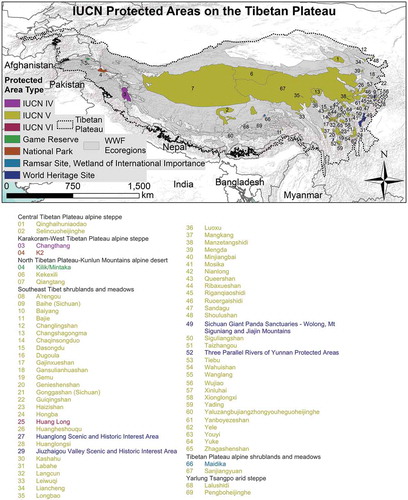
Table 1. Changes in NDVI using summer AVHRR imagery (15 July to 30 July) from GIMMS3g over the Tibetan Plateau (above 3,000 m) from 1982 to 2015.
Table 2. Changes in NDVI over six ecoregions on the Tibetan Plateau using summer AVHRR imagery (15 July to 30 July) from 1982, 2000, and 2015. Mean and SD of NDVI and number of pixels with no significant change in NDVI, number of pixels with significant increase in NDVI, and number of pixels with significant decrease from 1982 to 2015.
Figure 3. Changes in NDVI using AVHRR from GIMMS3g between 1982 and 2015 over the Tibetan Plateau and ecoregions.
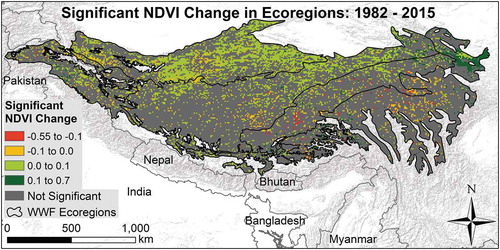
Table 3. Protected areas on the Tibetan Plateau with area from Protected Planet GIS polygons, NDVI values in summer 1982 and 2015 from AVHRR imagery from GIMMS3g, protected areas that have had a significant change in NDVI from 1982 to 2015, mean population in protected areas from LandScan in 2015 and significant change in population 2000 to 2015.
Figure 4. Changes in NDVI using AVHRR from GIMMS3g between 1982 and 2015 in protected areas.
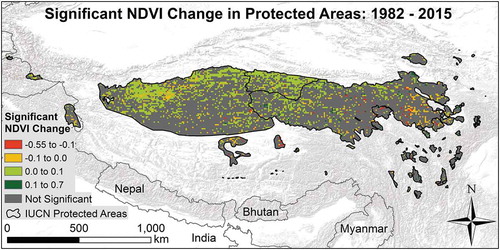
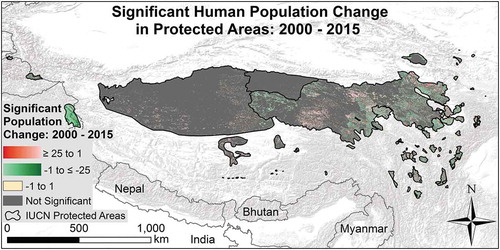
Figure 5. Changes in human population from LandScan inside sixty-nine protected areas on the Tibetan Plateau from 2000 to 2015. The color ramp indicates a significant increase or decrease in population from 2000 to 2015 per 1-km LandScan pixel. Grey areas indicate no significant changes.