Figures & data
Figure 1. Mountain areas classified into four regions. Black arrows represent dominant storm tracks from Arctic and Pacific Oceans.
Figure 2. Selection of long-term maximum NDVI. (a) For each 2002–2017 growing season, the maximum NDVI was selected for each 250-m pixel. In this example, an NDVI value of 0.78 (white circle) was selected from early July. (b) Aggregation of 250-m maximum NDVI values to 1-km NDVI value. (c) Selection of long-term maximum NDVI from 2002–2017 1-km maximum NDVI time series.
Figure 3(a). One hundred-meter elevation lapse rate with decadal July temperature. The lapse rate per 1,000-m elevation gain was −4.3°C/km for cold Arctic class, −4.2°C/km for Arctic, −4.4°C/km high-precipitation, and −4.5°C/km for interior mountain class. (b) 2002–2017 mean long-term maximum NDVI by elevation zone.
Figure 4(a). Mean long-term (2002–2017) maximum NDVI by precipitation class. (b) Mean long-term (2002–2017) maximum NDVI by temperature class. Each class was computed from at least 100 1-km pixels. Each mountain class had a second-order polynomial trend line with R2 > 0.97, p < 0.01.
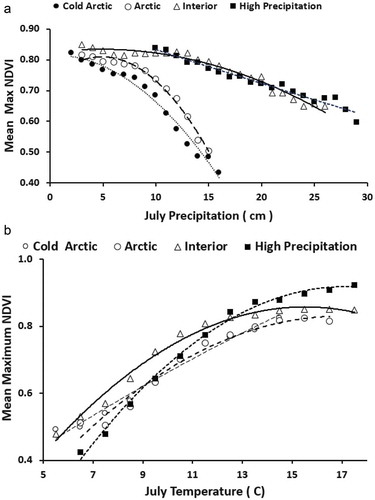
Figure 5(a). Negative relationship between mean long-term (2002–2017) maximum NDVI by precipitation for cooler temperature classes from all mountain pixels. (b) Positive relationship between mean maximum long-term NDVI by precipitation for warmer temperature classes from all mountain pixels. All linear trends were significant (p < 0.01) except for the 12°C trend line.
Figure 6. Mean Pearson’s r from 2002–2015 interannual maximum NDVI and July temperature by 100-m elevation zone. Each mean was based on at least thirty 1-km pixels. A Pearson’s r of >0.43 would be required for a significant (one-tailed p < 0.05) correlation with a sample size of 14 years (2002–2015).
Figure 7. Areal percentage of structural vegetation by elevation zone within interior mountains region.
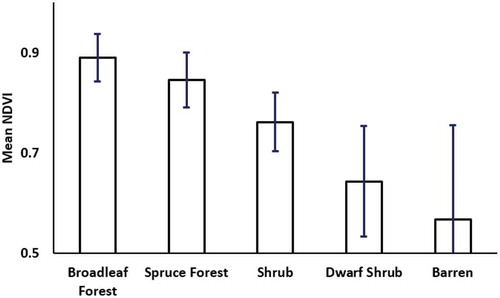
Figure 8. Interior mountains mean long-term maximum NDVI by land cover class. Majority vegetation type was determined based on 30-m NLCD pixels each 1-km NDVI pixel. Error bars represent one standard deviation of long-term maximum NDVI at 1-km pixel size.