
Figures & data
Figure 1. (a) The domain for case study and experiments. Dm denotes the domain for the case study, and Dm1, Dm2, and Dm3 denote the domains for experiments. (b) The surface synoptic observations from land station in Dm3 used for verification with the terrain height (shading) above sea level.
Table 1. Details of the information for the surface synoptic observations from land station used for verification.
Figure 2. (a), (c), (e): Sea level pressure (hPa, black solid) and wind speed (m s−1) at 950 hPa (black arrow) for the analysis field of ASRv2 with the marine cold air outbreaks index (M, color shading) over Greenland. (b), (d), (f): The 500 hPa geopotential height (m, black solid) and potential temperature (K, red solid) for the analysis field of ASRv2 over Greenland. The “L” represents the center of polar lows. Note that the domain is the case study domain (Dm) shown in .
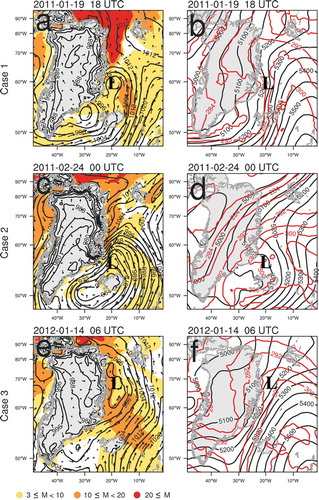
Figure 3. (a), (d), (g): The 500 hPa anomaly of the temperature (K); (b), (e), (h): geopotential height (m); and (c), (f), (i): potential vorticity (K m2 kg−1 s−1) for each case (positive anomaly: solid, negative anomaly: dashed) with the 700 hPa vertical wind speed (color shading) for the analysis field of ASRv2. The “L” denotes the center of polar lows. Note that the domain is the case study domain (Dm) shown in .
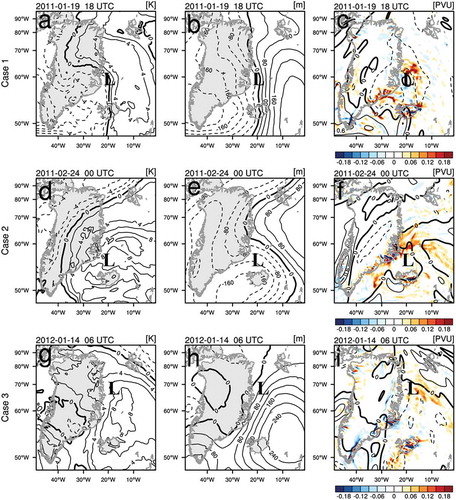
Figure 4. The sea level pressure (hPa, black solid), 950 hPa temperature (K, red solid), and 10 m wind speed (m s−1, color shading) and direction (black arrow) for 24-h forecast of Case1: (a) Exp1 for Dm2, (b) Exp1 for Dm3, (c) Exp2 for Dm2, and (d) Exp2 for Dm3. The sea level pressure (hPa, black solid) for 24-h forecast of Exp1 and the difference between Exp1 and Exp2 (Exp2–Exp1) for the 24-h forecast of 10 m wind speed (m s−1, color shading) of Case1 for: (e) Dm2 and (f) Dm3. Note that the domain of (a), (c), and (e) is Dm2 and that of (b), (d), and (f) is Dm3, shown in .
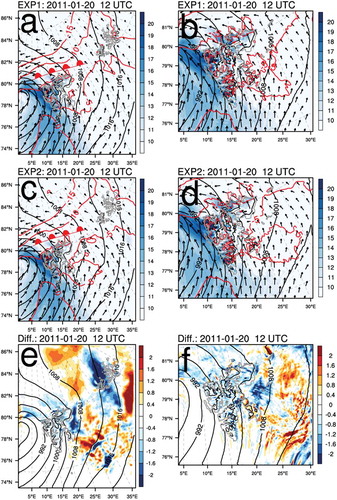
Table 2. Average forecast error statistics in Dm3, for 10-m wind speed (average value for the last 10 minutes before the observation time and highest 10-minute average wind for the last 1 hour) of each case at each observation station.
Figure 5. Time series of observations and 25-hour to 30-hour forecasts of Exp1 and Exp2 in Dm3 for 10-m wind speed (m s−1) in Case 1 (AW: black solid, HAW: black dashed, MG: gray solid, Exp1: blue solid, Exp2: red solid). AW = average value for the last 10 minutes before the observation time; HAW = highest 10-minute average wind for the last 1 hour; MG = maximum gust (3 seconds) for the last 10 minutes; WMO = World Meteorological Organization.
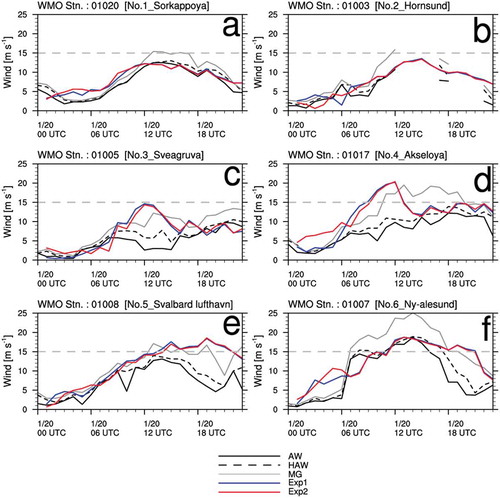
Figure 6. The sea level pressure (hPa, black solid), 950 hPa temperature (K, red solid), and 10 m wind speed (m s−1, color shading) and direction (black arrow) for 24-h forecast of Case2: (a) Exp1 for Dm2, (b) Exp1 for Dm3, (c) Exp2 for Dm2, and (d) Exp2 for Dm3. The sea level pressure (hPa, black solid) for 24-h forecast of Exp1 and the difference between Exp1 and Exp2 (Exp2–Exp1) for the 24-h forecast of 10 m wind speed (m s−1, color shading) of Case2 for: (e) Dm2 and (f) Dm3. Note that the domain of (a), (c), and (e) is Dm2 and that of (b), (d), and (f) is Dm3, shown in Figure 1.
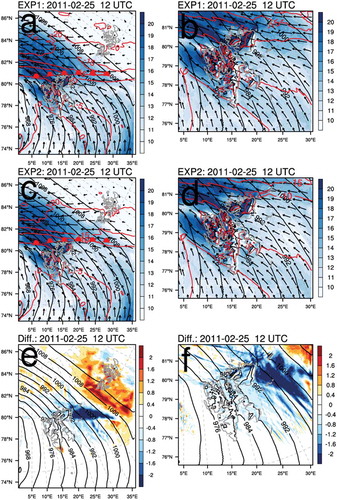
Figure 7. Time series of observations and 25-30 h forecasts of Exp1 and Exp2 in Dm3 for 10 m wind speed (m s−1) in Case 2 (AW: black solid, HAW: black dashed, MG: grey solid, Exp1: blue solid, Exp2: red solid). WMO = World Meteorological Organization.
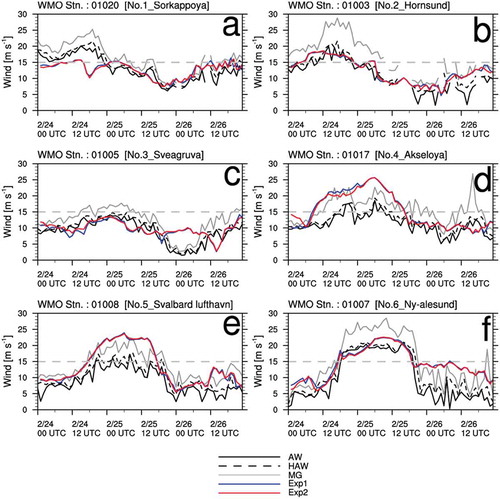
Figure 8. The sea level pressure (hPa, black solid), 950 hPa temperature (K, red solid), and 10 m wind speed (m s−1, color shading) and direction (black arrow) for 24-h forecast of Case 3: (a) Exp1 for Dm2, (b) Exp1 for Dm3, (c) Exp2 for Dm2, and (d) Exp2 for Dm3. The sea level pressure (hPa, black solid) for 24-h forecast of Exp1 and the difference between Exp1 and Exp2 (Exp2–Exp1) for the 24-h forecast of 10 m wind speed (m s−1, color shading) of Case 3 for: (e) Dm2 and (f) Dm3. Note that the domain of (a), (c), and (e) is Dm2 and that of (b), (d), and (f) is Dm3, shown in Figure 1.
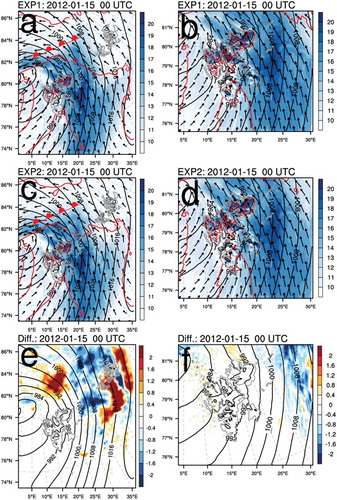
Figure 9. Time series of observations and 25-30 h forecasts of Exp1 and Exp2 in Dm3 for 10 m wind speed (m s−1) in Case 3 (AW: black solid, HAW: black dashed, MG: grey solid, Exp1: blue solid, Exp2: red solid). WMO = World Meteorological Organization.
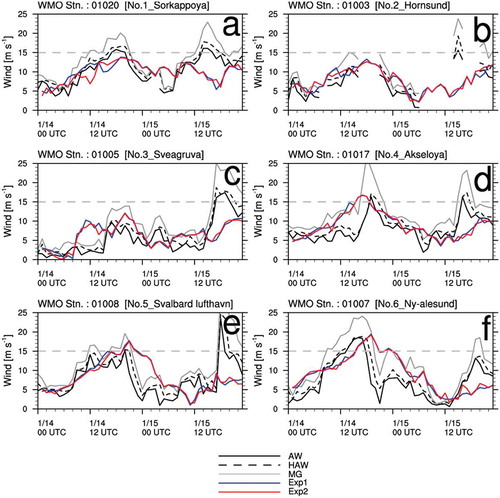
Table 3. Average forecast error statistics in Dm3 for the sea level pressure of each case at each observation station.