
Figures & data
Figure 1. Study area and sampling sites (bold) in South Greenland.
Figure 2. Data subdivision and modeling scheme. UPA = Upernaviarsuk data set; SIA = Søndre Igaliku data set; 2nd SG = second Savitzky-Golay derivative; s.p. = smoothing points; CV = cross-validation.
Table 1. General statistics on SOC (%) reference data for the two complete datasets, data used for calibration model development, and validation datasets used in this study.
Figure 3. Mean spectra of the complete vis-NIRS data set from Upernaviarsuk (UPA) and Søndre Igaliku (SIA).
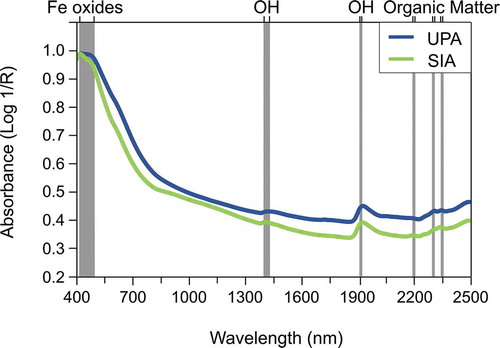
Figure 4. Principal component analysis of the investigated vis-NIRS data sets reported in scores (a) and (c) and plot of PC1 (b) and PC3 (d) ladings.
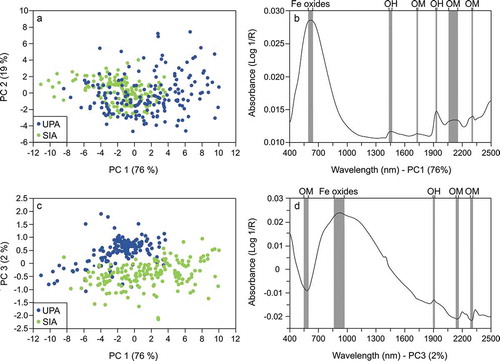
Table 2. Calibration statistics for the optimal calibration models used in this study.
Figure 5. Regression coefficients on the Upernaviarsuk and Søndre Igaliku calibration model vis-NIRS data set.
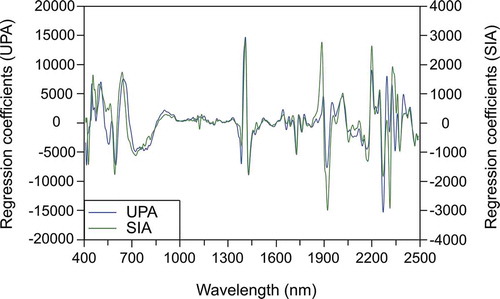
Figure 6. Independent validation of calibration Model 1 (Upernaviarsuk) and Model 2 (Søndre Igaliku).
Figure 7. Independent validation of the enlarged calibration models when using selection according to soil organic carbon values for enlargement.
Figure 8. Principal component analysis results to support model performance.
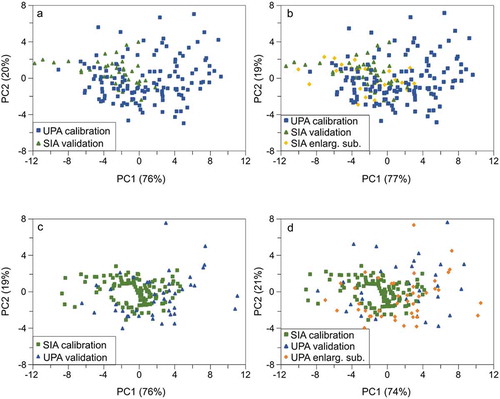
Table A1. Independent validation model statistics.