
Figures & data
Figure 1. Locations of study sites across the national border with reindeer fence between Finland and Norway. Reindeer grazing pressure is lower and missing during summer on the Norwegian side, where abundance of lichens on dry tundra gives a whitish tone in the false-color image. The Finnish side has a historical legacy of high grazing pressure throughout the year, indicated by the lack of lichen cover, and is now used as summer pasture imposing high grazing pressure on mire habitats.
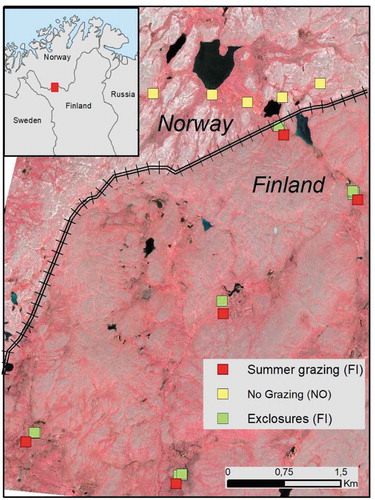
Figure 2. Grazing treatments have overlapping ranges with the nongrazed Norwegian subplots that have less variation in a two-dimensional nonmetric multidimensional scaling ordination. (a) Data from exclosure subplots in 2002 (before the effect of exclosure) and grazed subplots in 2015 combined as one group (Finland, grazed). Finland: Exclosures consist of subplots in exclosures in 2015. Norway: Nongrazed area consists of subplots in Norwegian fens in 2002 and 2015. (b) Combined data from 2002 and 2015 show nearly complete overlap; the range of vegetation variation is similar between years. Combinations of different years and grazing regimes are shown in more detail in Appendix 4.
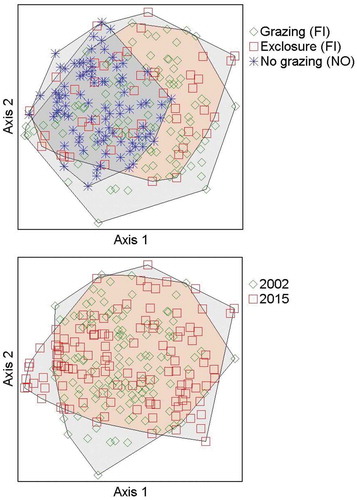
Table 1. Analysis of variance results of treatment effects (Finland grazed, Finland exclosures, Norway nongrazed) from linear mixed effect models for abundances of different plant functional and taxonomic groups. Abundance was estimated in July 2015 using a point intercept method.
Figure 3. Abundances of different plant functional and taxonomic groups (a)–(i) in grazed plots, exclosures (Finland), and nongrazed (Norway) plots in July 2015. The abundance of plant groups has been estimated by a point intercept method. (j) Normalized Difference Vegetation Index in July 2015 and (k) leaf area index measured in July 2016. Leaf area index was measured only in exclosures and grazed plots (Finland).
Figure 4. Changes in mean (±SE) (a) Salix lapponum height and (b) Salix spp. abundance over the study period (2002, 2006, and 2015).
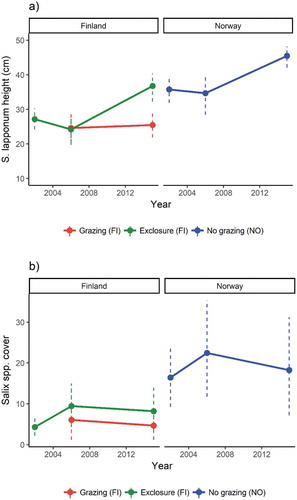
Figure 5. Comparisons of Salix lapponum (a) height (cm), (b) leaf area (mm2), (c) leaf nitrogen concentration (% of dry mass), (d) number of fertile female plants, and (e) number of flowering catkins, and between grazed sites and exclosures (Finland) and nongrazed sites (Norway) measured in 2015.
Table 2. Analysis of variance results from linear effect models for S. lapponum height and Salix spp. abundance over time (2002, 2006, and 2015).
Table 3. Analysis of variance results of treatment effects (Finland grazed, Finland exclosures, Norway nongrazed) from linear mixed effect models for Salix lapponum height, leaf area, nitrogen concentration, and flowering traits measured in July 2015.