Figures & data
Figure 1. Thermal structure of a lake in southwest Greenland during the first two weeks of July in an early (2016) and a late (2015) ice-off year. These data are based on thermistor strings collecting data at 1-m intervals in the water column. Colored contours represent temperature changes (°C) throughout the water column over time.
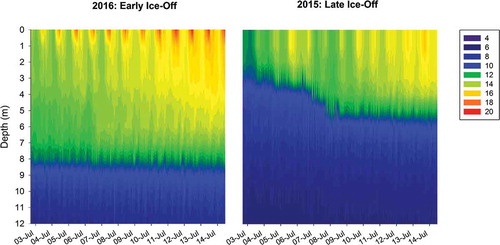
Table 1. Physical and chemical data from the epilimnia of the two lakes used in the whole-lake manipulation study during 2013 and 2014. The detection limit for DIN was 2 µg L−1; otherwise, values were below detection (bd).
Figure 2. Changes in control and experimental lake thermal structure during the open water seasons of 2013 and 2014. The experimental lake was manipulated in 2014.
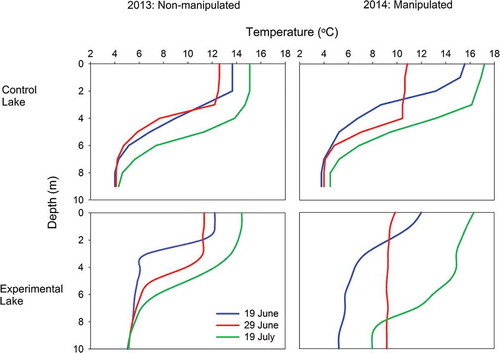
Figure 3. Changes in the density (cells mL−1) of major phytoplankton phyla in the sediment trap of a control lake (top panel) and an experimentally manipulated lake (bottom panel) in southwest Greenland in 2013 and 2014. The experimental lake was manipulated in 2014.
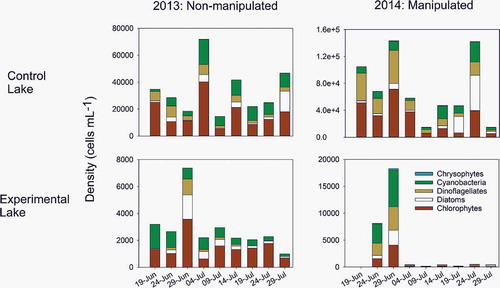
Figure 4. Changes in the biovolume (µm3 mL−1) of major phytoplankton phyla in the sediment trap of a control lake (top panel) and an experimentally manipulated lake (bottom panel) in southwest Greenland in 2013 and 2014. The experimental lake was manipulated in 2014.
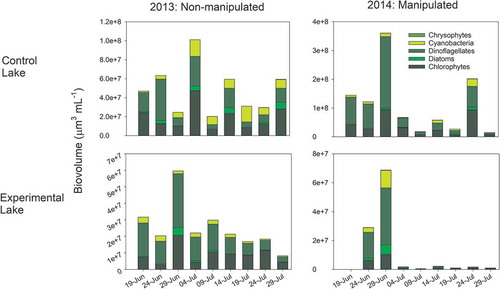
Table 2. Total zooplankton abundance (number of individuals per sample) and the relative abundance of major zooplankton groups in the two lakes used for the whole-lake manipulation in 2013 and 2014. Cladoceran zooplankton were not found in either lake at any time.
Table 3. Proportions of explained variance and relative contributions of environmental variables to phytoplankton phyla distributions in southwest Greenland lakes as determined by CCA.
Figure 5. Canonical correspondence analysis biplot relating physicochemical and biological data in southwest Greenland lakes across the summer season of 2013. Physical and chemical parameters are represented with vector arrows; phytoplankton phyla fall along vectors that best predict their distributions across the landscape of southwest Greenland.