Figures & data
Figure 1. Distribution of the seventeen meteorological stations and Gongshan hydrological station in the upper Nu–Salween River basin. Meteorological stations include Amdo (1), Nagchu (2), Damxung (3), Sog County (4), Biru (5), Dingqing (6), Neiwugi (7), Qamdo (8), Lhari (9), Luolong (10), Bomi (11), Baxiu (12), Zuogong (13), Markam (14), Chayu (15), Deqin (16), and Gongshan stations, and the numbers in the brackets link those in the map
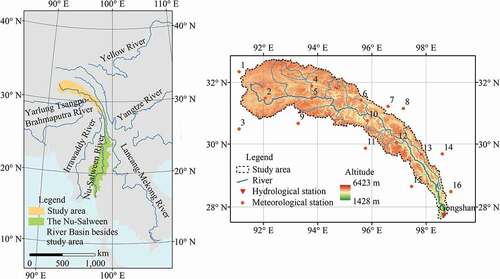
Figure 2. Distribution of mean annual surface freezing days detected from SSM/I daily brightness temperature data in the study area. The numbers for the meteorological stations are the same as those in
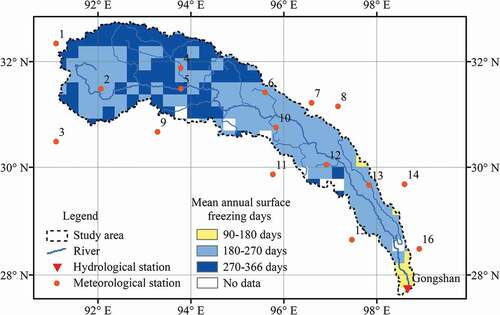
Figure 3. Mean monthly air temperature and surface freezing area variations in the study area (1988–2008). Error bar represents one standard deviation
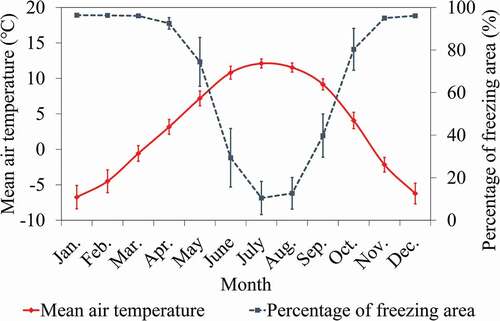
Figure 4. Interannual variations in mean air temperature and surface freezing area in the study area in (a) September and (b) October
Figure 5. Changes in the average onset date of continuous surface freezing in the study area
Figure 6. Relationship between mean air temperature and surface freezing area in the study area in September and October
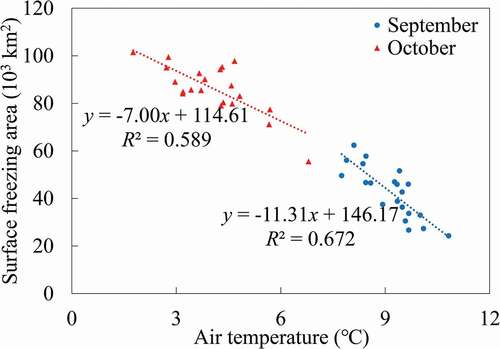
Table 1. Intra-annual distribution of streamflow at Gongshan station (1988–2008)
Figure 7. Relationship between the flow at Gongshan station in October and that from November to the following February in the study area
Figure 8. Baseflow at Gongshan station calculated from digital filter algorithm using different filter parameters and times
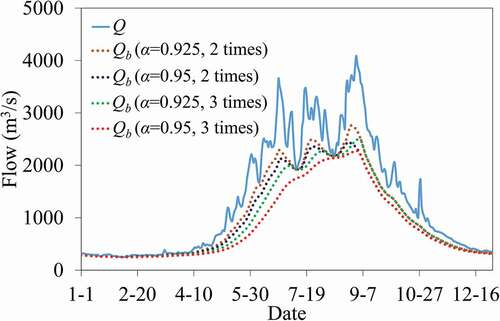
Figure 9. Relationship between the baseflow index at Gongshan station from September to October and the onset date of continuous surface freezing