1,846
Views
6
CrossRef citations to date
0
Altmetric
Research Article

Alpine plant community diversity in species–area relations at fine scale

ORCID Icon, , ORCID Icon & ORCID Icon
Pages 41-46 | Received 03 Jul 2019, Accepted 21 Nov 2019, Published online: 16 Jan 2020

Figures & data

Table 1. GLM results for the dependent species–area slope with the independent site variables. The contribution is the percentage that each source in the analysis of variance table contributes to the total sequential sums of squares

Table 2. Commonality analysis, which partitions the R2 in simple and multiple regressions, for the three independent variables that were significant in the GLM

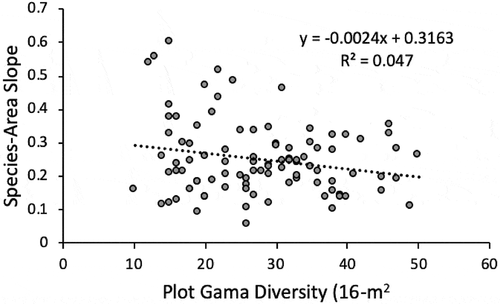
Figure 1. The species–area slope regressed on the plot gamma diversity; the relationship is significant at p < .05

Figure 1. The species–area slope regressed on the plot gamma diversity; the relationship is significant at p < .05
Supplemental material

Supplemental Material

Download Zip (917.5 KB)