Figures & data
Figure 1. Location of the study area, its topography, and the positions of temperature measurement transects across the Sugnugur Valley (indicated by T1–T4; see details in ). The inset shows the PPI (at 1-km resolution), which indicates the likelihood of permafrost existence at a global scale (Obu et al. Citation2019). The hydroclimatic station (green dot) is situated at 1,193 m.a.s.l. BH = the position of the two boreholes located on the north-facing slope near transect 3
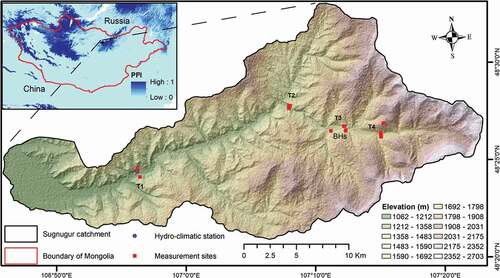
Table 1. Descriptions of temperature measurement sites. South-facing slopes with greater inclination receive higher potential potential solar radiation (PSR)
Table 2. Parameters used in the article and their calculation
Figure 2. Flowchart of the methodology
Figure 3. (a) An example of the temperature variability during the study period and (b) the locations of temperature measurements, typical topography, and land cover in the study region as valley transect. The temperature values are five-day averages
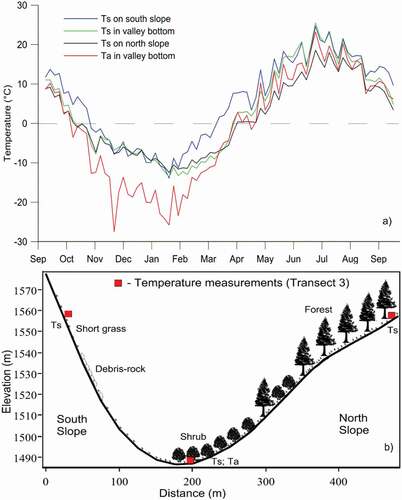
Figure 4. Calculated TDDs and FDDs at the hydroclimatic station. The study period covers the complete thawing and freezing seasons when the iButton measurements were conducted
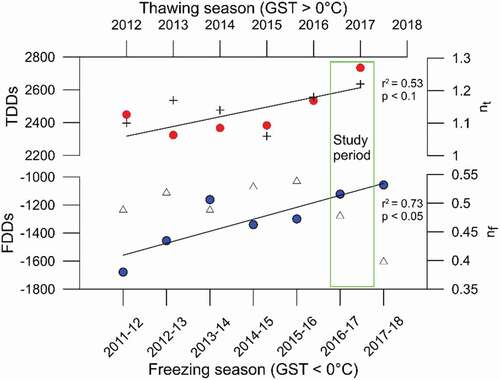
Table 3. Mean and maximum snow depth (cm) at the hydroclimatic station site, together with ground surface temperature (Ts, °C), air temperature (Ta, °C), and incoming solar radiation (ISR, Wm−2) in winters since 2012
Figure 5. Calculated n-factors at each transect during the study period. Values greater than 1.0 indicate lower Ts during the freezing season and higher Ts during the thawing season relative to Ta
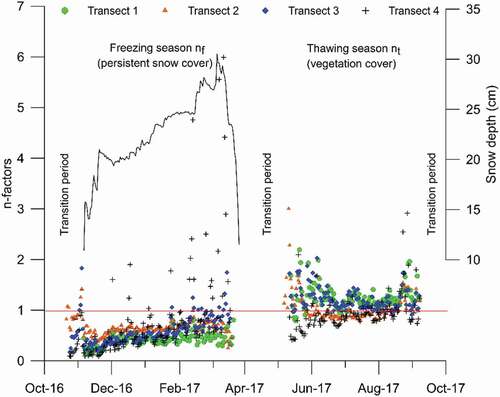
Table 4. Observed surface offset and n-factors at the measurement sites
Table 5. Pearson’s correlation coefficient (r) matrix between some parameters;
Figure 6. (a) Distribution curves of ten-day average potential radiation and observed and adjusted air temperatures at transect 3. After time lag and FT adjustments, the variance between potential radiation and temperature was significantly reduced. (b) The linear regression on the right shows the correlation between the adjusted Ta and potential radiation at transects 2 and 3. The linear equation was later applied for the estimation of MAT for 2016–2017
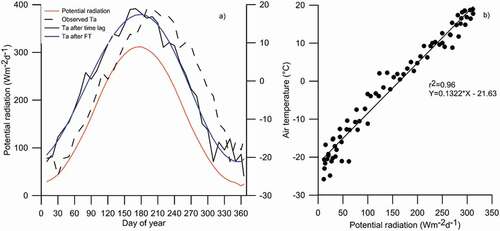
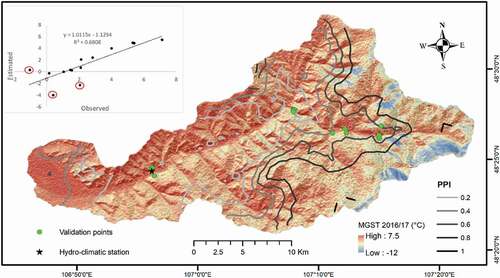
Figure 7. Calculated MGST in the Sugnugur catchment for 2016–2017. The PPI lines indicate the permafrost probability index from Obu et al. (Citation2019). The inset shows the relationship between the observed MGST at individual sites and the estimated MGST. Red circles mark the outliers described in the text