Figures & data
Figure 1. Locations of sampling sites in Northwest Territories, Canada. Sites 1-6 and 7-9 (filled circle) are located on hummocky microrelief on clayey and sandy sediments, respectively. Sites 10-13 and 14-16 (clear circle) are located on non-hummocky (flat) microrelief on clayey and sandy sediments, respectively
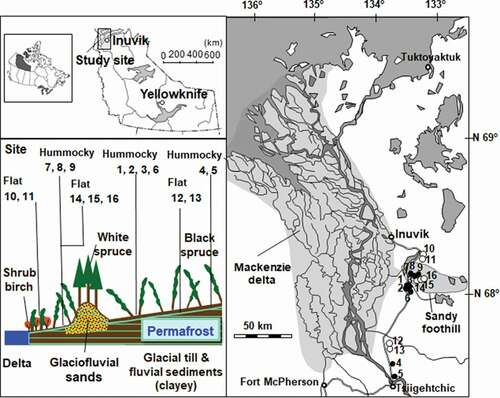
Figure 2. Schematic of soil hummocks showing measurements made on the mounds, in the depressions, and on leaning (drunken) trees
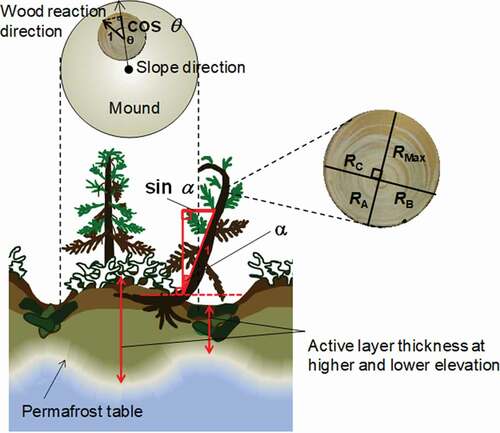
Table 1. Physicochemical properties of hummocky and non-hummocky soils on glaciofluvial sands and clayey sediments
Table 2. Morphological properties of soil hummocks and woods
Figure 3. Relationship between reaction wood formation and (a) distance along the tree trunk and (b) tree leaning angle (a) relative to the vertical axis at different tree positions from the ground (0 cm). The different letters (A–D, a–d) indicate that the values are significantly (p < .05) different between positions along the tree trunk in each class of tree leaning angles (a). Asterisks indicate that regression slopes are significantly (P < 0.05) different between positions along tree trunk
Figure 4. Relationship between wood reaction direction (cosθ) and extent of reaction wood formation
Figure 5. Relationships between the extent of reaction wood formation and permafrost table depth (active layer thickness) at lower elevation of mound edges and tops in clayey and sandy soils
Figure 6. Relationships between the extent of reaction wood formation and the difference in active layer thickness between higher and lower elevations of mounds [Depth gap (A–B)]. Data sources are listed in
![Figure 6. Relationships between the extent of reaction wood formation and the difference in active layer thickness between higher and lower elevations of mounds [Depth gap (A–B)]. Data sources are listed in Table 2](/cms/asset/0fa4b8b6-a8e5-4c16-8461-8d0900de3362/uaar_a_1712858_f0006_b.gif)
Figure 7. Tree ring widths in wood disks of trees growing on clayey mound edges (Nos. 1–33; clear), growing on sandy mound edges (Nos. 39–44; yellow-colored), and exhibiting normal growth on non-hummocky microrelief (Nos. 17, 22, 46; shaded)
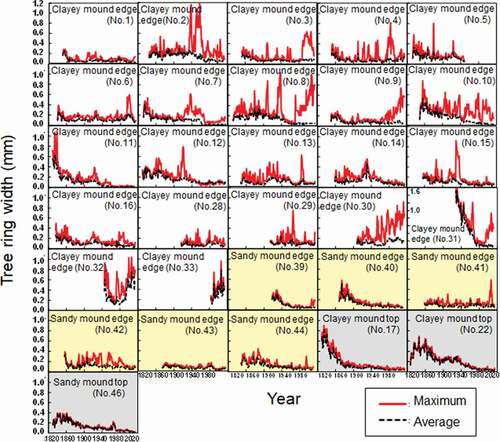
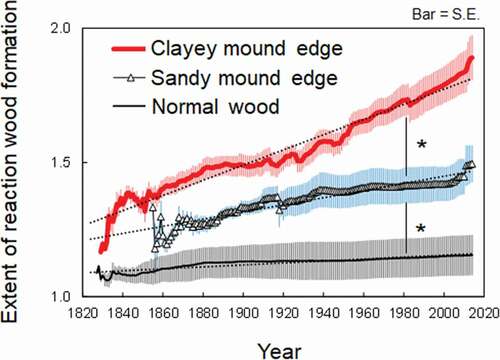
Figure 8. Reaction wood formation of trees growing on clayey mound edge (n = 22), trees growing on sandy mound edge (n = 6), and trees growing on non-hummocky soil (n = 3). The pink, blue, and gray bars indicate standard errors. The symbols (*) indicate that regression slopes are significantly (P < 0.05) different between positions along tree trunk