Figures & data
Figure 1. Location of the study area: (A) (1) the meteorological station in Kuujjuarapik (black square) and the other meteorological stations (black dots): (2) Kuujjuaq (Quebec), (3) Inukjuak (Quebec), (4) Fort George (Quebec), and (5) Moosonee (Ontario). (B) Detailed location of the sampling sites (red circles)
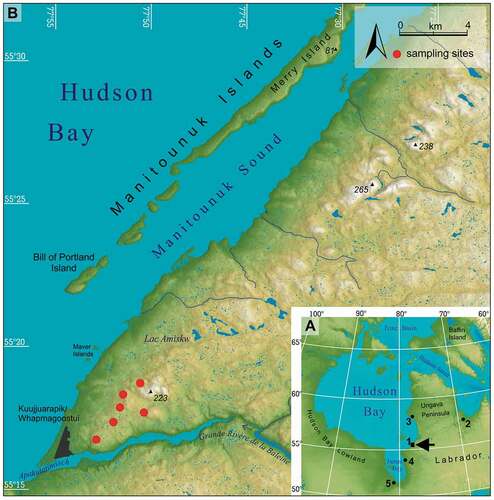
Figure 2. Average (A) monthly climate variations, (B) monthly extreme air temperatures, (C) monthly number of days with rain or snow, and (D) snow cover depth for the Kuujjuarapik meteorological station (12.2 m a.s.l., Quebec, Canada). Tmax abs = the highest monthly averaged daily maximum air temperatures; Tmax avg = average of Tmax; Tmin avg = average of Tmin; Tmin abs = the lowest monthly averaged minimum daily air temperatures. Averages calculated from years with complete monthly data between 1925 and 2017 as shown in Figure 6.
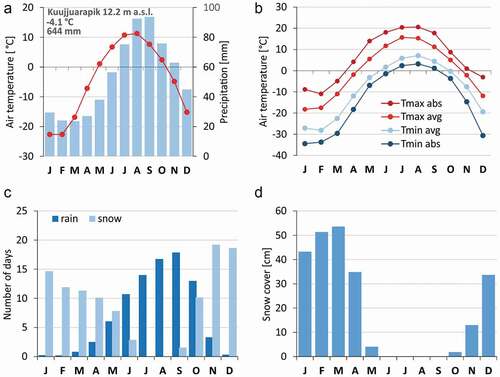
Figure 3. Photographs of (A) lichen–spruce woodlands with Picea glauca [Moench] Voss and shrub vegetation on rocky outcrops and (B) bearberry willow growing on exposed granitic rock cracks
![Figure 3. Photographs of (A) lichen–spruce woodlands with Picea glauca [Moench] Voss and shrub vegetation on rocky outcrops and (B) bearberry willow growing on exposed granitic rock cracks](/cms/asset/a56ca928-3eb2-4796-ae52-e62f17769bc5/uaar_a_1722397_f0003_oc.jpg)
Figure 4. Selected features of bearberry willow wood anatomy, important from a dendrochronology point of view: well-defined semi-ring porous growth rings with (A) regular and (B) variable widths, (C) wedging and locally absent growth rings, and (D) reaction wood with gelatinous cells
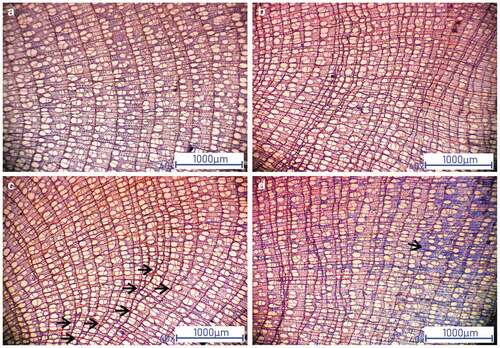
Figure 5. Example of the bearberry willow serial sectioning technique. Positions of sampling microtome sections within individual plant and corresponding growth ring width curves
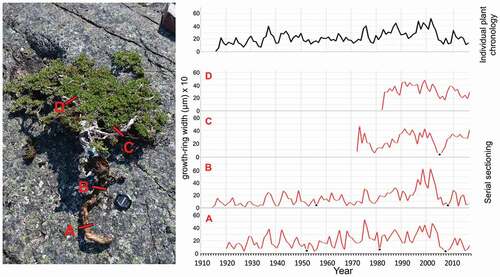
Table 1. Definitions of thermal and precipitation indices
Table 2. Correlation coefficients between monthly air temperatures at Kuujjuarapik and corresponding air temperatures at neighboring stations. The monthly air temperatures from these stations were used to reduce the gaps in the Kuujjuarapik series. h - altitude m a.s.l
Figure 6. Temporal coverage of climatic data for the Kuujjuarapik station. Lines represent years with complete monthly data calculated according to the rules adopted in this article. S = snow, R = rain, P = precipitation, SC = snow cover, Tmax = maximum air temperature, Tmin = minimum air temperature, Tavg = average air temperature
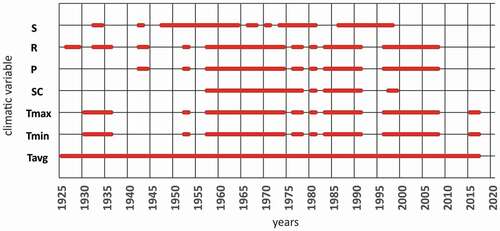
Figure 7. Time series plot of the bearberry willow (A) ring width and (B) index chronologies for the eastern shore of Hudson Bay covering the last 105 years. Red line indicates eleven-year moving average. Gray shading represents changing sample sizes between years. Note the decline in growth in recent decades
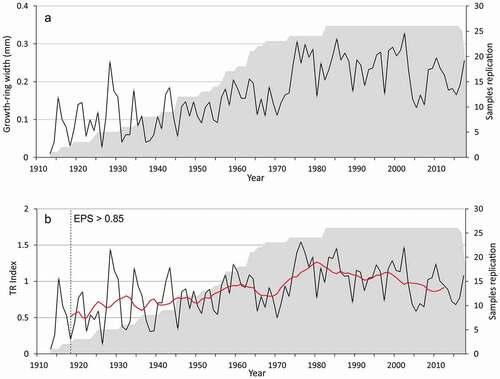
Table 3. Meteorological conditions accompanying the formation of negative dendrochronological years
Figure 8. Single-month and strongest seasonal correlations of the bearberry willow chronology. Tavg = average air temperature; PToT = precipitation total, Tmax = maximum air temperature, Tmin = minimum air temperature, TmaxH = absolute maximum air temperature, TminL = absolute minimum air temperature. Statistically significant values are marked by colored bars (p(a) < .05, n = 35, 1957–1992)
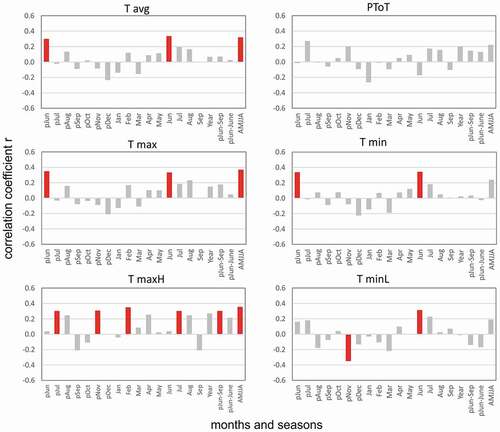
Figure 9. Results of climate–growth response analyses comparing the bearberry willow chronology and various (A) thermal, (B), (C) precipitation, and (D) snow indices calculated based on daily data from the Kuujjuarapik meteorological station. Gray shading indicates statistically insignificant values (p(a) > .05, n = 35, 1957–1992)
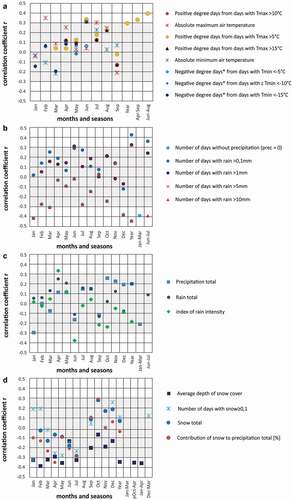
Table 4. Trends in selected precipitation indices and mean temperature impacting (significantly correlated) the radial growth of bearberry willow for the period 1957–2014
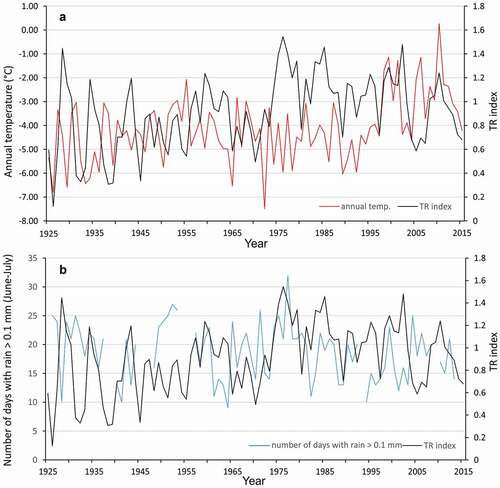
Figure 10. Comparisons of variability of bearberry willow growth rings indices with (A) annual mean temperature and (B) number of days with rain >0.1 mm