
Figures & data
Figure 1. Simplified geological map of the project area, modified after Schäffer et al. (Citation2018) and Kogler (Citation2018). Relief shading was taken from the Tyrolean Geographic Information System (Citation2019). The continuous red line indicates the catchment area of the sink; dashed red lines mark possible extensions of the catchment relating to the Tuxbachquelle
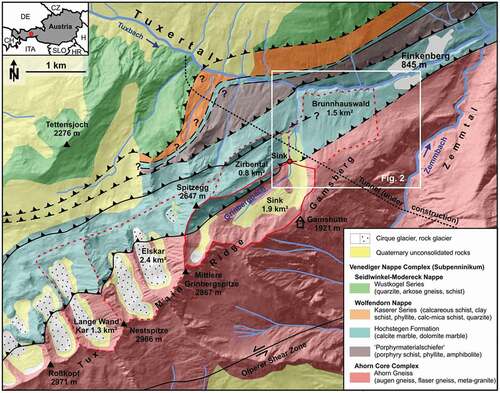
Figure 2. Position plan of the measuring points for both tracer tests: light blue circles indicate springs; dark blue circles creeks. The map background was taken from the Tyrolean Geographic Information System (Citation2019). Overview of the first and maximal uranine transit in the different measuring points during the tracer tests at low (QLOW) and high (QHIGH) runoff
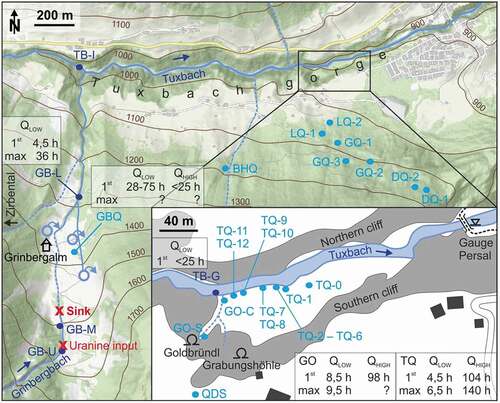
Figure 3. Measured extinctions in the Tuxbach gorge during the first hours of the tracer test at low runoff
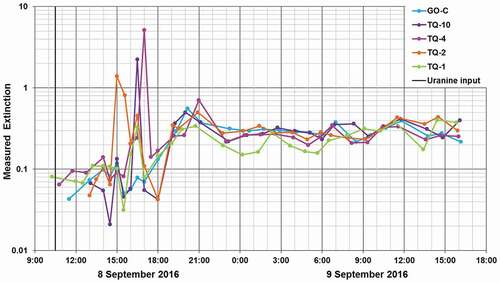
Table 1. Schedule for both tracer tests
Table 2. List of measuring points
Table 3. Qualitative classification of the activated carbon bags of the tracer test at low runoff
Table 4. Comparison of selected parameters of the measuring points within the Tuxbach gorge from 8 to 14 September 2016
Table 5. Comparison of selected parameters of the measuring points within the Tuxbach gorge from 7 to 29 June 2017
Figure 4. Measured extinctions during the tracer test at high runoff at selected measurement points in June 2017
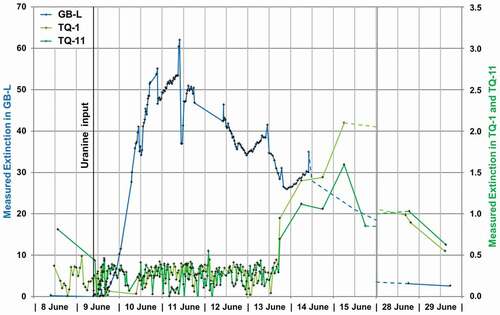
Table 6. Qualitative classification of the activated carbon bags of the tracer test at high runoff
Figure 5. Water temperature, electrical conductivity, and quantitative estimated turbidity at the Tuxbachquelle (outlet TQ-1) in comparison to precipitation at Gamshütte. Important precipitation events are marked with a gray background
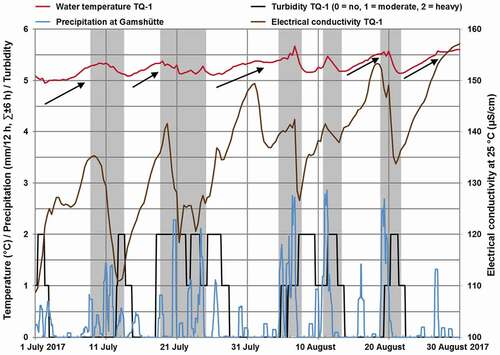
Figure 6. Water temperature, electrical conductivity, and estimated discharge based on photos at Goldbründl (measuring point GO-A) in comparison to precipitation at Gamshütte. Important precipitation events are marked with a gray background
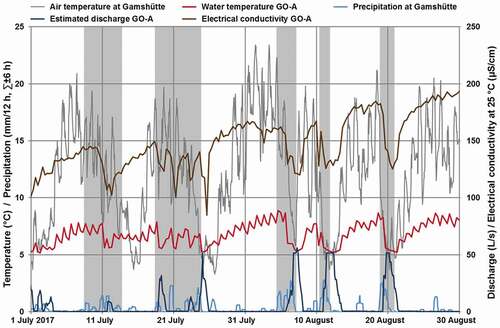
Table A1. Chemical properties of Grinbergbach at low runoff compared to spring water at the beginning and end of the tracer test. Samples taken in September 2016