
Figures & data
Figure 1. Sample site location map (dashed line designates the Chukchi graben rift system after Astakhov et al. [Citation2010] and bottom current after Vologina et al. [Citation2016]). Basement produced by the Ocean Data View 4 software (Schlitzer Citation2012)
![Figure 1. Sample site location map (dashed line designates the Chukchi graben rift system after Astakhov et al. [Citation2010] and bottom current after Vologina et al. [Citation2016]). Basement produced by the Ocean Data View 4 software (Schlitzer Citation2012)](/cms/asset/661d2dd7-60df-4a0d-81b4-bac7329fc96b/uaar_a_1738824_f0001_oc.jpg)
Figure 2. Morphology of the ferromanganese deposits analyzed
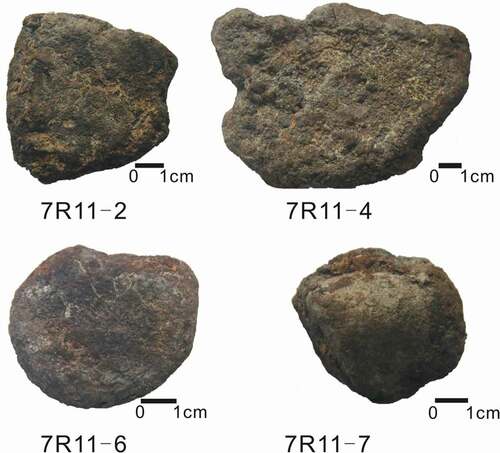
Figure 3. (a) X-ray diffraction patterns of representative ferromanganese deposits from the Chukchi Sea. (b) XRD patterns after heating at 75, 95, 150, and 300°C for 24 hours
Figure 4. PAAS-normalized diagrams for REE in the ferromanganese deposits from the Chukchi Sea (Pourmand, Dauphas, and Ireland Citation2012)
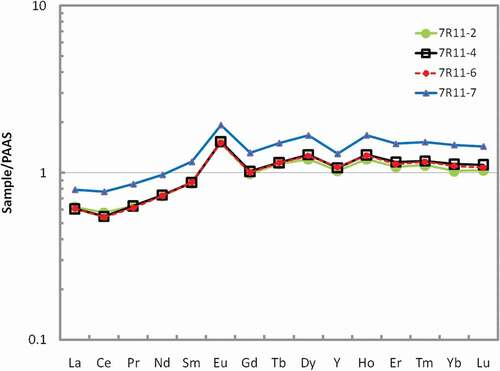
Figure 5. Binary discrimination diagrams for the ferromanganese deposits from the Chukchi Sea, after Bau et al. (Citation2014)
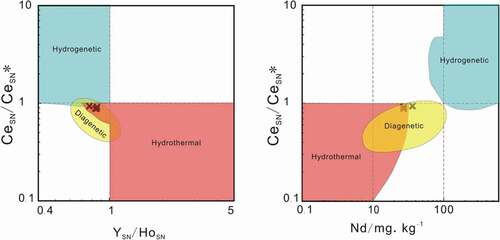
Table 1. Chemical composition of the ferromanganese deposits from the Chukchi Sea analyzed in this work