Figures & data
Figure 1. The study site in Chamkhar Chhu basin including glacial areas, all sampling locations, meteorological station, and flow gauge location. Top left inset: regional locator. Top right inset: cryospheric sampling points at the toe of the Thanagang glacier. Bottom left inset: river sampling locations at the main stem–Riphug tributary confluence
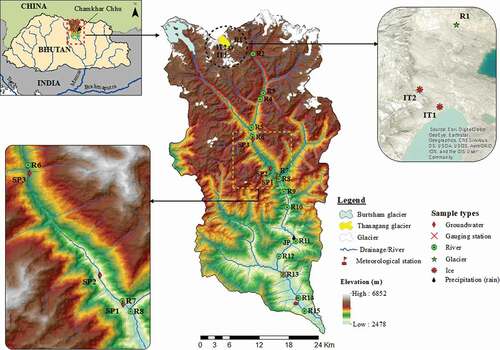
Table 1. Sampling locations in the Chamkhar Chhu basin
Figure 2. Hydroclimate data from 1996 to 2016 including 2016 water year indicating annual fluctuations for (top) temperature, (middle) precipitation, (bottom) and discharge data for the study region
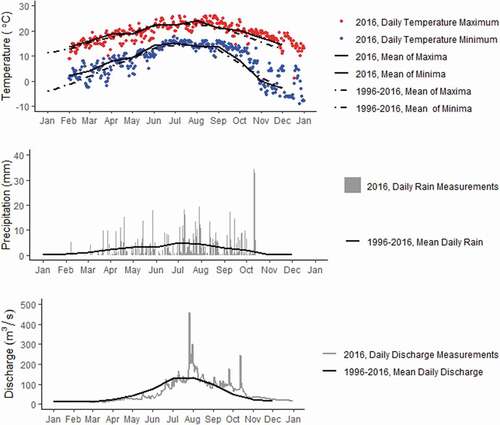
Figure 3. The δ18O gradient of river water samples with elevation. Precipitation δ18O is available during four months and is shown at the elevation of the rain collector. Dashed lines represent isotopic gradient trendlines for river water below 4,095 m
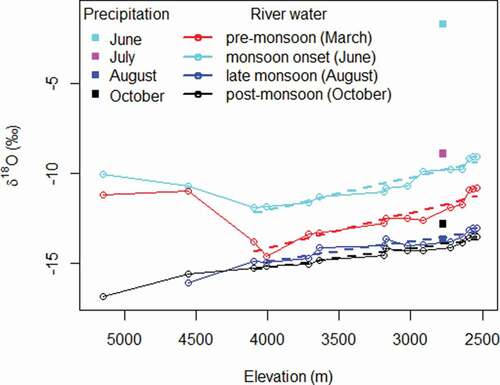
Table 2. Summary statistics for isotopic relationships of seasonal river waters relative to the GMWL (slope = 8, intercept = 10) and RWL as shown in
Figure 4. The isotopic relationship of seasonal river water and end-member samples relative to the GMWL. The RWL shown is derived from three bulk precipitation samples. The highly enriched June rain sample plots off the page (inset)
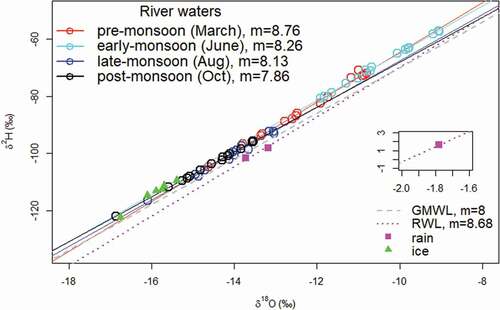
Figure 5. The evolution of solute concentrations in river water across the elevation gradient. Solutes shown are SO42− (top) and Ca2+ (bottom)
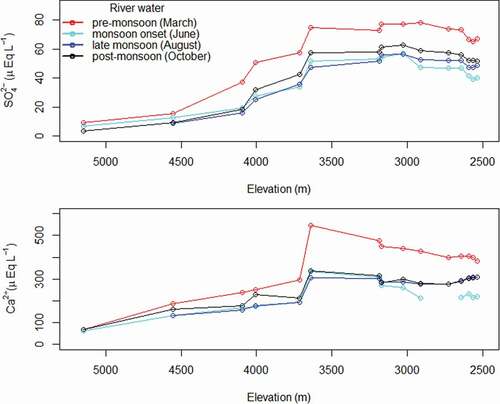
Figure 6. The δ18O–SO42− biplots with river, ice, and groundwater end-members for the months of March, June, August, and October. The Tsampa tributary inflow is also shown for reference. Dashed lines represent mixing lines and mixing triangles connecting likely river water end-members
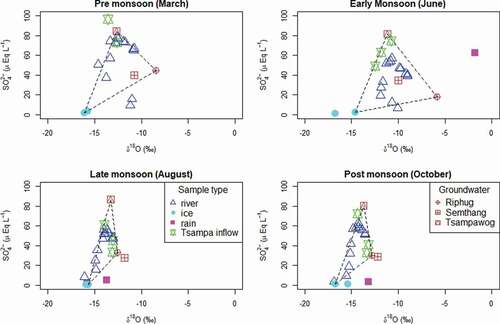
Figure 7. Hydrograph separation utilizing the SO42− tracer to identify flow path composition of river water over the elevation gradient. Variations in flow paths are shown seasonally: premonsoon (top left), early monsoon (top right), late monsoon (bottom left), and postmonsoon (bottom right). The error bars (red) represent the uncertainty (95 percent confidence) for each component
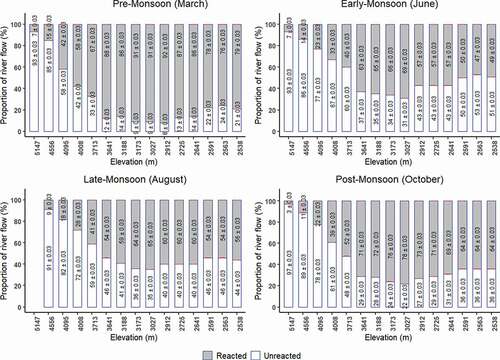
Figure 8. Hydrograph separation utilizing the δ18O tracer to identify source water composition of river water over the elevation gradient. Variations in flow paths are shown for early monsoon (left) and postmonsoon (right). The error bars (red) represent the uncertainty (95 percent confidence) for each component
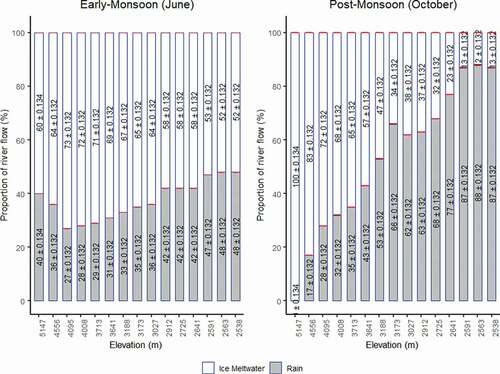
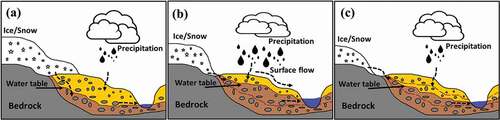
Figure 9. Conceptual diagram indicating flow paths during (a) premonsoon, (b) monsoon, and (c) postmonsoon periods in the Chamkhar Chhu basin across elevations