Figures & data
Figure 1. (a) Donjek Glacier (dark blue outline; RGI Consortium Citation2017). The thick black line indicates the separation between the down-glacier surge-type and up-glacier non-surge-type portions of the glacier at 21 km from the terminus, and the thick green line indicates the dynamic balance line (DBL) at 8 km. (b) Location of Donjek Glacier in southwestern Yukon; red box indicates extent of the main image. Base image from Landsat 8, 23 September 2017
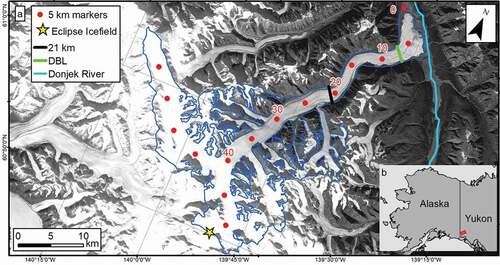
Figure 2. Surge event timing. Gray bars indicate uncertainty for surges before the satellite era. Black bars indicate duration of active surge phase for the last four surge events, well constrained by satellite imagery. For details, see Kochtitzky et al. (Citation2019)
Table 1. Ice core characteristics
Figure 3. Ice core accumulation and depth–age scale (ECL02_2019 timescale). (a) Mean picked observed depth–age scale from the 2002 ice core. Red box indicates the section of the ice core that was used to create . (b) The 1996, 2002, and 2016 ice core accumulation records since 1770. The Nye and Hooke models provide the bounds on the uncertainty (gray) for accumulation from the 2002 ice core
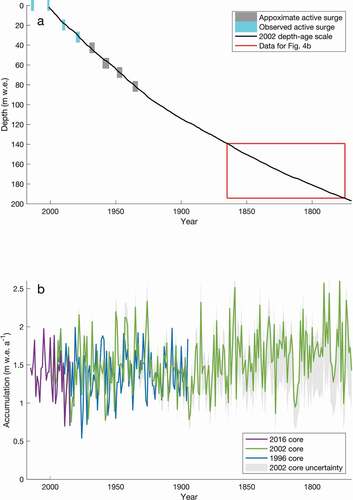
Figure 4. Cumulative snow accumulation between surge events derived from the ice cores. (a) Cumulative annual accumulation from 1996, 2002, and 2016 ice cores between each surge event. Green (Burwash Landing) and black (NARR) circles indicate cumulative PDDs between surge events on the secondary y-axis. After each quiescent period, the accumulation is reset to zero, because each set of escalating bars represents a single quiescent period (e.g., 2001 to 2012; same for Figure 4b). (b) Accumulation offset record. The cumulative accumulation from the 2002 ice core is offset by 160 years, the estimated time needed for surface snow/firn/ice to travel from Eclipse Icefield to the constriction at 21 km from the terminus, where the primary portion of the glacier actively involved in surging begins (see ). Solid and dashed black lines show the mean value and one standard deviation cumulative accumulation average between surge events. The part of the ice core where this originates is indicated by the red box in
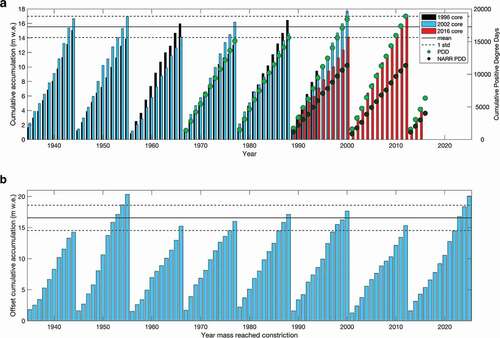
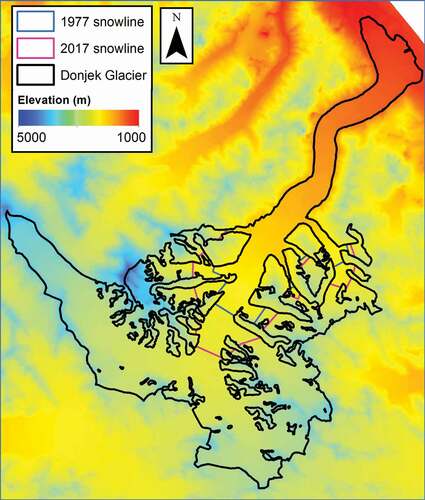
Figure 5. Climate in the Donjek Glacier region: (a) Snow line measurements for the main trunk of Donjek Glacier from the last available satellite image of the annual melt season in July, August, or September with error bars indicating one standard deviation and linear trend over the study period. (b) Burwash Landing annual average temperature record (red) with linear trend (thin red) and NARR temperatures from 1,400 to 1,600 m on Donjek Glacier from winter, summer, and annual mean with linear trend. (c) Mean annual snow accumulation record from 1996, 2002, and 2016 ice cores from Eclipse Icefield with linear trend (R2 = 0.00; red line) and ten-year moving average. (d) Precipitation recorded at Burwash Landing with annual and monthly totals from 1967 to 2012; the monthly data (black vertical bars) emphasize the month each year with the most precipitation. Dark blue horizontal bars indicate a period when Donjek Glacier was known to surge (Kochtitzky et al. Citation2019)
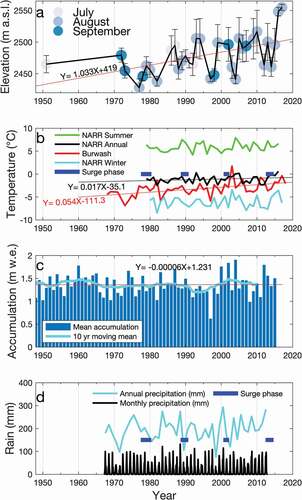
Figure 6. SPOT-5 DEM of Donjek Glacier from 13 September 2007, showing the highest (2017) and lowest (1977) summer transient snow lines in the satellite record