
Figures & data
Figure 1. Outline of the workflow from LiDAR data to snow volume done in ArcGIS Pro
Table 1. Values derived from snow-on/snow-off differences in LiDAR measured snow volume for the year 2014 (snow-off) and 2018 (snow-on)
Figure 2. The model workflow for the topographical shielding index is graphically represented in three steps
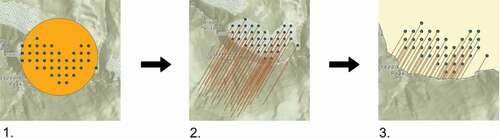
Figure 3. (a) Sampling locations on the Palisade Glacier shown here with shielding index value gradient overlaid (37.1009° N, 118.5116° W). GPS points refer to glacier center mean. (b) Sampling locations on the Middle Palisade Glacier for 2018 and 2019 shown here with shielding index value gradient (37.0703° N, 118.4620° W). GPS points refer to glacier center mean for the southern section of the Middle Palisade Glacier. The northern section of the Middle Palisade Glacier (37.0753° N, 118.4687° W) was not sampled due to inaccessibility
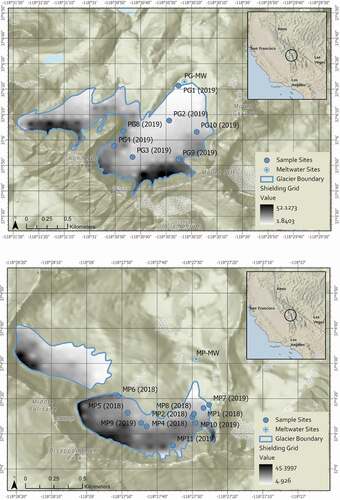
Table 2. Parameters for the slope-dependent thickness estimations and the resulting values for glacier thickness, total volume, and glacier ice volume
Table 3. Average concentrations for the surface snow on each glacier sampled for milligrams per liter of snow water and for meltwater given in milligrams per liter water
Figure 4. The relationship between topographical shielding index (τ) and concentration is logarithmic, shown here with error bars representing standard deviation between triplicate samples taken at each sampling location
Figure 5. Chart depicts the percentage of the glacier that is either highly shielded (τ ≥ 30), moderately shielded (τ = 15–30), or minimally shielded (τ ≤ 15). Because of the geomorphology of the Palisade Glacier, 60 percent of the glacier has low shielding and shows higher deposition versus the Middle Palisades, which only has low shielding over 22 percent of its area
Table 4. Mass of 4NP for each glacier compartment in units of kilograms ± 95 percent confidence interval