Figures & data
Figure 1. IKONOS multispectral data for the study sites: (a) Cape Bounty Arctic Watershed Observatory (CBAWO), Melville Island, Nunavut (collected in 2004); and (b) Sanagak Lake (SL), Boothia Peninsula, Nunavut (collected in 2001). IKONOS images are displayed as color infrared composites: Bands 4 (near infrared), 3 (red), and 2 (green)
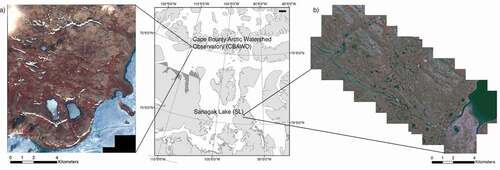
Table 1. Classification summary for dry, mesic, and wet vegetation types at the Cape Bounty Arctic Watershed Observatory (CBAWO) and Sanagak Lake (SL)
Table 2. p Value results from two-way repeated measures analysis of variance (ANOVA) testing the effect of site (Cape Bounty Arctic Watershed Observatory versus Sanagak Lake), vegetation type (dry tundra versus mesic tundra versus wet tundra), and time on gross ecosystem exchange (GEE), ecosystem respiration (ER), and net ecosystem exchange (NEE). Numbers within the brackets signify degrees of freedom between and within groups respectively
Figure 2. Mean daytime carbon dioxide (CO2) exchange rates for the Cape Bounty Arctic Watershed Observatory (CBAWO): (a) dry tundra (DT), (b) mesic tundra (MT), (c) wet tundra (WT); and Sanagak Lake (SL): (d) DT, (e) MT, and (f) WT. Positive CO2 exchange rates indicate CO2 loss to the atmosphere, whereas negative signed values indicate CO2 gain to the vegetation type. Error bars represent standard error of the mean
Table 3. Averaged carbon dioxide (CO2) flux rates for the duration of the study period (mmol CO2 m-2 s-1) with standard error in parentheses (by vegetation type and geographic location)
Figure 3. Interpolated total daily carbon dioxide (CO2) exchange rates for dry tundra (DT), mesic tundra (MT) and wet tundra (WT) at the Cape Bounty Arctic Watershed Observatory (CBAWO) and Sanagak Lake (SL) during the study period
Table 4. Multiple linear regression analysis for plot-level daily averaged carbon dioxide (CO2) exchange rates in relation to averaged environmental variables (p < .05)
Table 5. Bivariate linear regression and analysis of covariance (ANCOVA) results for carbon dioxide (CO2) exchange components gross ecosystem exchange (GEE), ecosystem respiration (ER), and net ecosystem exchange (NEE) with the normalized difference vegetation index (NDVI) for the Cape Bounty Arctic Watershed Observatory (CBAWO) and Sanagak Lake (SL)
Figure 4. Combined bivariate linear regressions for carbon dioxide (CO2) exchange rates: gross ecosystem exchange (GEE), ecosystem respiration (ER), and net ecosystem exchange (NEE)
Table 6. Normalized difference vegetation index (NDVI) model-based carbon dioxide (CO2) exchange rates for the Cape Bounty Arctic Watershed Observatory (CBAWO) and Sanagak Lake (SL)
Figure 5. One-to-one comparisons of actual calibration values and normalized difference vegetation index (NDVI) modeled values for gross ecosystem exchange (GEE), ecosystem respiration (ER), and net ecosystem exchange (NEE)
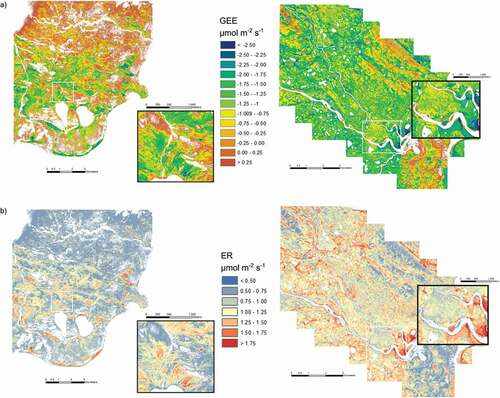
Figure 6. Spatially-explicit models of (a) gross ecosystem exchange (GEE) and (b) ecosystem respiration (ER) for the Cape Bounty Arctic Watershed Observatory (CBAWO) (left) and Sanagak Lake (SL) (right). White indicates no flux data