Figures & data
Table 1. Albedo of lichen species measured in previous studies
Figure 1. Location of Imingfjell in southern Norway and a picture of the study area showing that the lichen heaths are mainly found on the ridgetops and the shrubs on the ridgetops and midslopes
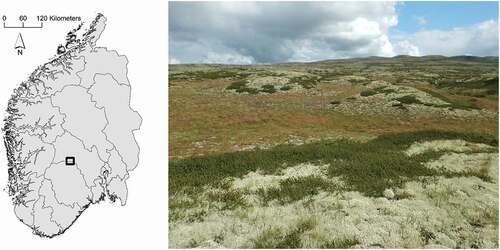
Figure 2. Two-day average albedo of the lichen and corresponding shrub plots. The mean (±SE) albedo for the lichen plots is 0.255 (±0.007) with a minimum of 0.227 and a maximum of 0.284. The mean (±SE) albedo for the shrub plots is 0.132 (±0.003) with a minimum of 0.115 and a maximum of 0.148
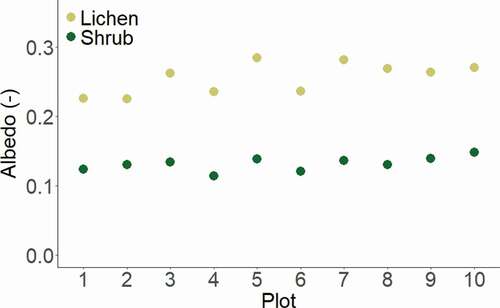
Table 2. Criteria for the selection of lichen-dominated plots and corresponding shrub-dominated plots
Figure 3. Linear regression between albedo and the percentage of most abundant species within all lichen plots. Plots (a)–(f) are light lichens, plot (g) is a dark lichen, and plots (h) and (i) are shrub species
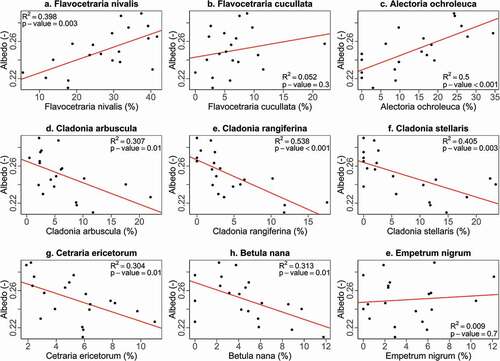
Table 3. Result of the best beta regression model using albedo as dependent variable and aspect, slope, and total percentage of Cladonia spp. as explanatory variables
Figure 4. DCA ordination of all lichen plots. Species labels consist of the first three letters of the genus and the first three letters of the species names (see Supplementary Information 9 for clarification). Arrow indicates the direction of increasing albedo. The ellipses cluster the group of species associated with a low albedo and the group of species associated with a high albedo according to the linear regressions in Figure 3
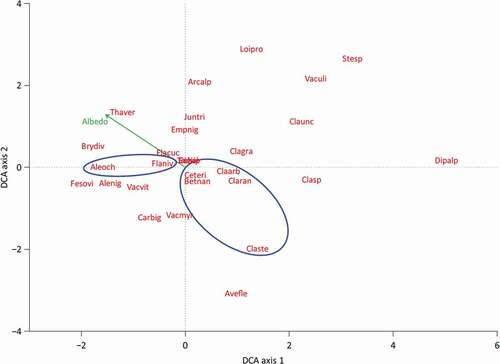
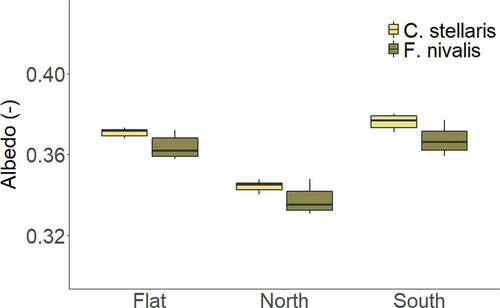
Figure 5. Measured albedo during the controlled experiment of Cladonia stellaris and Flavocetraria nivalis grouped by different aspects (n = 6 days for each box plot)