
Figures & data
Table 1. Study sites, transects, and plot locations for tree-ring and temperature measurements. UTL and the tree core plots lower are upright trees; the remaining plots are krummholz
Figure 1. Map of the study region in the eastern Sierra Nevada, California, with location of four transect sites. See for site names
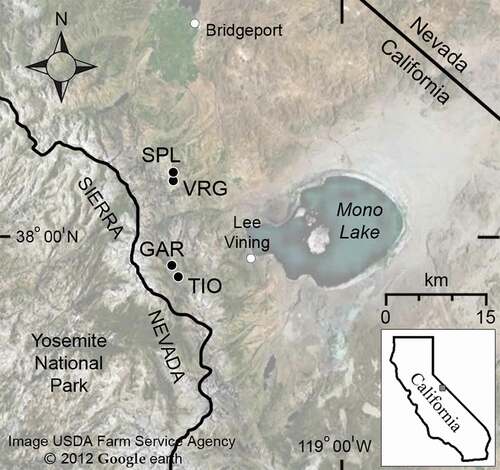
Figure 2. Transect design. Transects extended from UTL to ALP, with intermediate plots at MKR and UK (upper species line). Two pairs of transects were installed on adjacent northern and southern aspects for a total of four transects
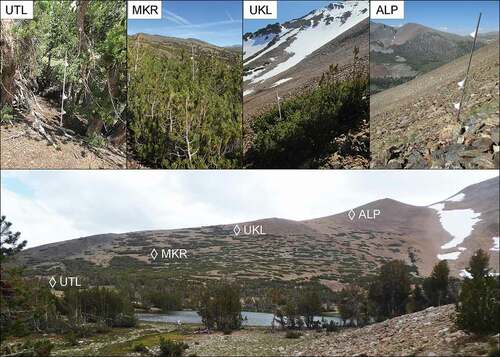
Figure 3. Plot design. At each plot, six temperature loggers were deployed: three on a PVC pole, at 2.0 m, 1.0 m, and 0.5 m height; one buried 10 cm at the base of the pole; and two ground surface loggers, one at the base of the pole and one approximately 5 m distant
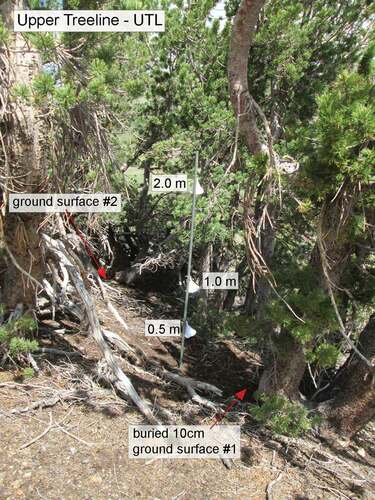
Table 2. Temperature and growing season means based on daily means. Annual temperature (Tann); minimum (Tann-min) and maximum (Tann-max) annual temperature; GST; GSL; warmest month temperature (Twarm); number of DSF
Figure 4. Overlay plots for mean 2.0 m air temperature and mean 10 cm buried temperature, July 2015 to October 2019 for paired TIO (north) and GAR (south) transect sites, upper treeline and upper species line. (a) UTL at TIO; (b) UKL at TIO; (c) UTL at GAR; (d) UKL at GAR
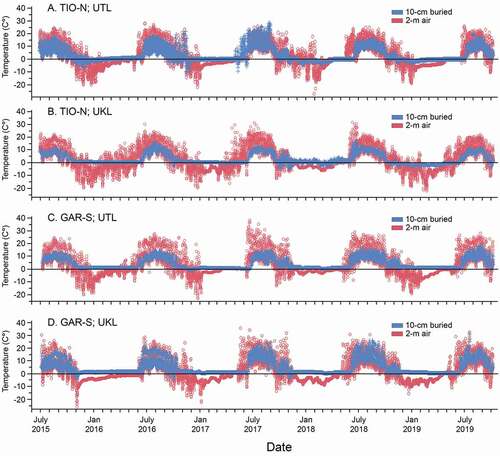
Table 3. Mean number of rings (estimate of age) and number of series (cores) contributing to tree-ring demography database for krummholz and tree plots
Figure 5. Tree ring series, demography data set. Dated series from 456 live krummholz and upright trees sampled along four transects. Series pooled and arranged by upper elevation krummholz, middle elevation krummholz, and lower elevation (upper treeline) forest strata. All stems were live at the time of sampling
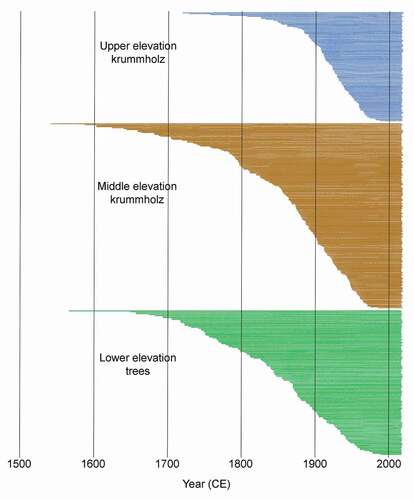
Figure 6. (a)–(c) Whitebark pine radial growth and (d)–(f) composite HCN climate station means (monthly means, averaged annually, 1895–2020). Climate data averaged for Tahoe, Yosemite, Mina, and Independence HCN stations. Black dots, ring widths; red line, mean ring widths; green line, linear fit; blue curve, spline fit at lambda 10
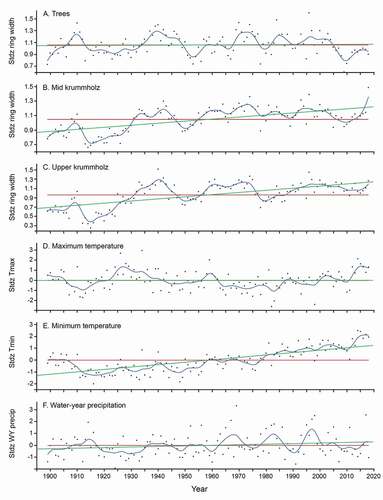
Table 4. Model correlations and climate variables included in the best-fit stepwise regression analyses for radial ring-width models, based on the date range 1895–2020.a