Figures & data
Figure 1. The dynamics of soil temperatures in 2016. Thin black line shows the soil temperature at 10-cm depth in the fellfield, thick black line shows surface temperature in the shallow snowbed, and thin gray line shows surface temperature in the deep snowbed, respectively
Figure 2. (A) Gravimetric soil moisture, (B) soil ammonium availability, and (C) soil nitrate availability in surface soil. Inorganic nitrogen availability was determined with the resin bag method (Binkley and Matson Citation1983). FF = fellfield, SS = shallow snowbed, DS = deep snowbed. Different letters shown under the habitat name indicate statistical difference by Tukey’s HSD multiple comparison test (p < .05). n.s. means not significant
Figure 3. Differentiation of functional traits among fellfield (FF), shallow snowbed (SS), and deep snowbed (DS): (A) aboveground biomass, (B) belowground biomass, (C) aboveground:belowground (S:R) ratio, (D) coarse root biomass, (E) fine root biomass, (F) coarse root:fine root (C:F) ratio, (G) SRL, and (H) root tip density. Different letters shown under the habitat name indicate statistical difference by Tukey’s HSD multiple comparison test (p < .05). n.s. means not significant
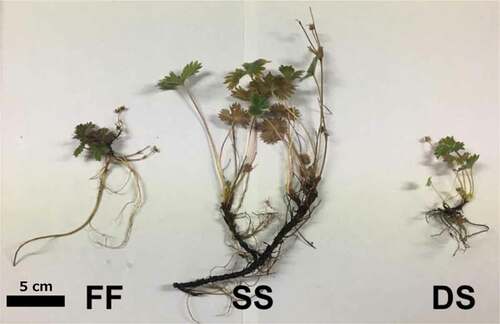
Figure 4. The representative individuals of Potentilla matsumurae in fellfield (FF), shallow snowbed (SS), and deep snowbed (DS)